The temporal profile of the aortic pulse wave has been given much attention, for the information it contains about either local blood flow, or the presence of wave reflections indicating the functional status of peripheral vascular beds. However, the changing spatial distribution of the wave as it propagates appears to be ignored, yet this could reveal discontinuities in transmission due to branching and sites of reflection.
In eight male(2.5-3.5 kg) anaesthetized, spontaneously breathing rabbits (sodium pentobarbitone, 50.0 mg kg-1 I.P. followed by infusion at 15-25 mg kg-1 h-1, I.V.), we recorded aortic blood pressure sequentially at multiple sites with a high fidelity, transducer-tipped catheter (Gaeltec 4F, diam. 1.2 mm) bearing 5.0 mm markings. This was advanced in 5.0 or 10.0 mm steps, through the left femoral artery as far as the aortic arch (240-260 mm), with recording for 10-20 s at each site, sampling at 1024 Hz. Also recorded were the diaphragm EMG, airflow, alveolar CO2 and the ECG (chest lead) together with a QRS-event pulse. All data were continuously acquired to hard disk using a CED 1401-plus interface and Spike2 v4 software. The rabbit was killed by an overdose of anaesthetic and the final position of the transducer defined in relation to the crest of the aortic arch. Off line, the event pulse was used to derive 250 ms duration, post-QRS-event averages encompassing one complete pulse wave at each recording site. The data were exported to a spreadsheet and transposed, and with Origin software, plots were made of the spatial distribution of pressure along the aorta at 1.0 ms intervals. The combined colour and symbol coding allowed superimposition of up to 40 plots at selected times to reveal transmission of a complete pulse wave comprising a total of 250 plots. Below, a selection of 5 plots illustrate certain principal features of aortic pulse wave transmission revealed by this approach; for simplicity only those occurring during systole are shown.
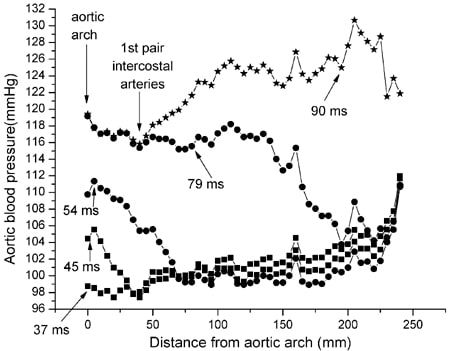
Figure 1 shows the spatial distribution of the pulse wave at the times indicated following the QRS-event pulse. Note (a) in the 45 ms plot, the rapid decrement of the pulse wave over the initial 25-30 mm of descending aorta which is branch-free; (b) in the 79 ms plot the plateau of pressure extending by then 140 mm along the aorta; and (c) at 90 ms, a major secondary rise in pressure, a reflection which earlier (not shown) had arisen near the thoracico-abdominal boundary (120 mm) and by back transmission had reached the first pair of intercostal arteries.
Thus, by the use of adequate frequency and spatial sampling, new aspects of pulse wave transmission can be revealed.