We have previously identified many examples of heterogeneity within the sinoatrial node (SAN) in terms of electrical activity, intracellular calcium handling and protein expression. Parameters often correlate significantly with cell size. To confirm our hypothesis that these correlations reflect spatial distribution within the node we have performed selective isolation of cells from different parts of the SAN structure.
Single cells were isolated from right atrial appendage (RAA), crista terminalis (CT) and peripheral and central SAN tissue obtained from New Zealand White rabbits which were humanely killed by intravenous overdose of anaesthetic (n = 6). Samples of tissue of 2 mm2 were taken, the central sample being centred on the leading pacemaker site and the peripheral sample from SAN tissue overlying the CT. Isolated cells were loaded with calcein using the acetoxymethyl ester form of the dye (5 µM, 30 min). Using a confocal microscope a series of images at 0.5 µm intervals on the z-axis were taken of single cells producing a complete 3-dimensional image of each cell. From these images the dimensions of the cells were obtained. Cell volumes were calculated by producing a rendered 3D volume image using Bitplane Imaris Measurement Pro (Bitplane AG, Zurich).
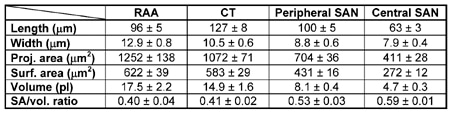
A summary of the data is shown in Table 1, which shows values for the length, width, projected area, surface area, volume and surface area to volume ratio for cells from the RAA, CT, periphery of the SAN and central SAN. Projected area refers to the total area covered by the cell, as would be observed during normal light microscopy, a dimension we have previously used as a measurement of cell size. Data were analysed using one-way ANOVA followed by Tukey comparisons.
Cells from the central SAN were shorter than cells from the periphery, and had a smaller projected area, surface area and volume (P < 0.05). Central cells did not differ from peripheral cells in terms of cell width or surface area to volume ratio. Peripheral cells were narrower than atrial cells, and had a smaller projected area, surface area and volume (P < 0.05). The cells of the CT were in many respects similar to atrial cells although narrower and longer (P < 0.05). The longer length of CT cells perhaps reflects optimisation of this tissue as a rapid conduction pathway within the heart. The surface area to volume ratio of cells from within the SAN is greater than that of other cells (P < 0.05), although there is no significant difference between cells from the periphery and centre of the SAN. This reflects the more spindle-shaped or even more complex morphology of the SAN cells compared with the more regular, almost rectangular atrial and CT cells.
Previous studies have endeavoured to divide SAN cells on the basis of cell shape into spindle-shaped, elongated, and spider cells. This study attempts to provide a more quantitative definition of this varied morphology. Regarding spider cells, which are SAN cells with multiple processes, of the 25 central cells studied 7 showed spider type morphology. None were identified from the peripheral SAN tissue. This suggests the spider cell type is concentrated within the central region of the SAN, the initiation site of the cardiac action potential. A more detailed knowledge of the cellular composition of the node will improve our understanding of SAN function and factors affecting the propagation of the cardiac action potential out of SAN and to the rest of the heart.
The authors would like to acknowledge the British Heart Foundation who funded this work.