
The belief that biological functions generally follow a linear decremental trend during aging has been greatly influenced by using linear models to evaluate the relationship between function and chronological age. We have recently suggested that such a progressive and smooth decline in function throughout the lifespan should not be assumed to be the case for many functions and that linear models may serve to oversimplify and indeed to mask trends in ageing data (1). We recommended another approach to evaluate ageing functional data whereby subjects are initially grouped into bands of equal functional values irrespective of their age. This examination showed that for several functions, especially in the mid age ranges, a linear negative relation did not hold between age and functionality. A new method of analysis is now proposed which minimizes assumptions about linearity or normality of data when investigating the relationship between chronological age and function. The method uses a permutation analysis which is an approach now applied to genetic data (2). In our model it is designed to find differences between a range of chronological ages and the physiological functional values allocated to those age ranges. The ages of any group of individuals are placed in chronological order and then split into a number of equal parts and the mean ages of each group calculated. The subjects are then sorted in a similar incremental order on the basis of their physiological function value and divided into a similar number of groups. If this given function is strongly influenced by ageing, the mean age of the groups selected on the basis of age should be very similar to the mean age of the group selected by function. A permutation test is used to determine if differences between chronological ordered data and functionally ordered data are statistically significant. In order to demonstrate the effectiveness of the method we applied it to a dataset (3) containing measured VO2 max (Figure 1). The VO2 max data shows an overall good correlation coefficient of -0.75 (p<0.01). Even when only the midrange ages are taken into account a moderate correlation of -0.57 (p<0.01) is still present. However, whilst the permutation test confirms the assumption that very young and old adults have significantly different VO2 max values (p<0.01), the subjects in the mid range are statistically indistinguishable (p = 0.20) i.e. showing no significant aging effect over this age range and challenging the effect found by linear correlation. The method presented here allows the complex relationships that are likely to exist between age and physiological function to be studied without making any assumptions regarding the nature of aging.
University of Manchester (2010) Proc Physiol Soc 19, C39
Oral Communications: A new method to evaluate the association between biological function and chronological age
J. H. Bergmann1, N. R. Lazarus1, S. D. Harridge1
1. Applied biomedical research, King's College London, London, United Kingdom.
View other abstracts by:
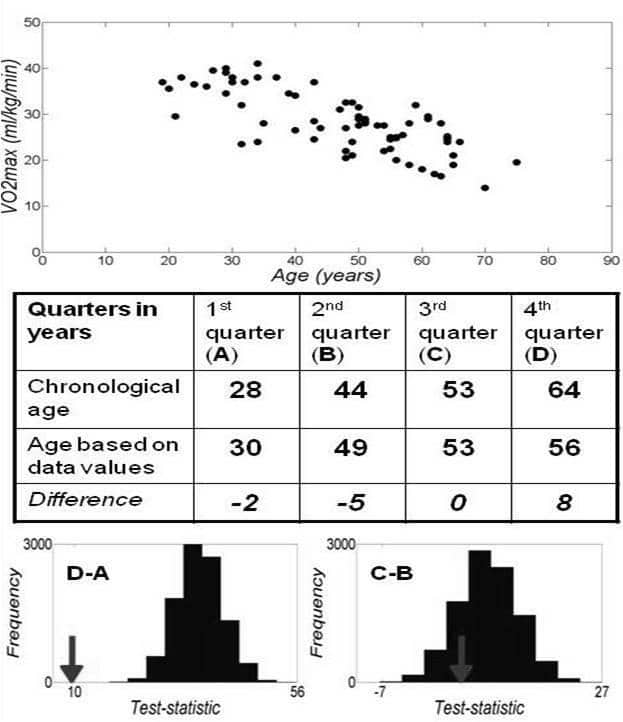
Figure 1. Analyzing VO2max data of women taken form Tanaka and Seals (2003) using a new method. The table shows the difference between the mean age of each quarter based on chronological age and functional values. Permutation tests are then performed to obtain a normal distribution of possible differences in mean ages for the 1st and 4th quarter (D-A) and the two middle quarters (C-B). The outcome is represented in the figures on the bottom left. The arrows indicate where the observed values are compared to the permutated values. The observed values for VO2max are significantly (p<0.01) different from the permutated values for the very young and very old (D-A), but not for the middle age groups (C-B).
Where applicable, experiments conform with Society ethical requirements.