
Sarcomere length (SL) is a key determinant of cardiac mechanical activity, yet its in situ value has not been identified in live tissue. We used two-photon fluorescence microscopy to assess SL in guinea pig isolated ventricular cardiomyocytes and Langendorff perfused whole hearts, stained with di-4-ANEPPS. Software is demonstrated that aids in automatic assessment of SL in complex biological scans. Hearts were extracted from female guinea pigs and swiftly (<90 s) connected to a Langendorff perfusion system for wash with normal Tyrode solution, containing (in mM): 140 NaCl, 5.4 KCl, 1 MgCl2, 1.8 CaCl2, 11 glucose, 5 HEPES, pH 7.4. Single cells were isolated enzymatically and exposed to 2.5 mM di-4-ANEPPS (Invitrogen, Paisley, UK) for 2 min. Whole hearts were stained by bolus application of the dye (4 mM dye in 25 ml of cardioplegic Tyrode). For imaging, whole hearts (n =2) were gravity perfused (120 mm Hg; flow ~5 ml min-1), cardioplegically arrested, and positioned in a lab-film lined cradle (shaped to suit individual heart geometry) to support stress-free positioning under the imaging objective. Hearts were imaged at room temperature with a multi-photon microscope (Leica TCS MP2, Wetzlar Germany), with excitation at 900 nm and collection from 400 to 600 nm. Sufficiently clear images were obtained at tissue depths of up to 400 μM (Fig. 1a). Software was developed to allow the user to select a region of interest (a start and end point of a path transversing the striation pattern of any cell in an image), which is used to obtain a one-dimensional fluorescence intensity profile by binning data for 5 pixels in both directions perpendicular to the user-selected path (Fig. 1b). This binned data set is analyzed by discrete Fourier transform (DFT, Fig 1c), excluding high and low frequency extremes outside a 1.5-3.0 μm range. The peak of the power spectrum is calculated by finding the maximum value, then curve fitting this frequency/amplitude pair and the two adjacent values with a second-order polynomial [1]. Deviations in the user-defined angle from ‘true perpendicular’ to sarcomeric striation are corrected by creating a set of twenty new paths by incrementing the path angle by one degree (i.e. over a range of ±10 deg) and selecting the path with the minimum SL. Since deviations of the cell angle in the z-direction are not eliminated by this step, a minimum SL is calculated by first determining the maximum angle of the cell from the imaging plane based on the length of the path and an assumed cell thickness of 20 μm, then by multiplying the SL by the cosine of this angle. The final SL is calculated as the average of the measured value and this minimum calculated value. Only values corresponding to a maximum 15% difference between measured and minimum values were used for analysis. Key challenges for in situ SL assessment include identification of suitable SL-related labeling, tissue penetration of the imaging method, motion artifacts, and angular differences between cell axis and the imaging plane. Combining di-4-ANEPPS loading (a membrane-bound dye which reveals t-tubular patterns that, in cardiac cells, are closely related to z-line location) with multi-photon imaging allowed us to address the first two challenges. Motion was minimized by imaging cardioplegically arrested hearts during constant pressure perfusion (attempts with constant flow were impeded by roller pump-induced motion). Angular deviation between the cell axis and imaging path always increase apparent SL and reduce apparent cell length (cosine error). In-plane deviation was automatically corrected to be as close as possible (±1 deg) to perpendicular relative to the striation pattern. Out-of-plane deviations (z-direction) between imaging plane and cell axis were reduced by removing short user-selected paths from analysis. Also, secondary indicators of z-planarity, such as constant width of neighbouring blood vessels (co-aligned to cells) were considered. The validity of the proceedures reported here will be confirmed in subsequent studies using laser ablation techniques to mark imaged tissue, followed by histological verification. Thus far, it emerges that SL in situ is significantly longer than SL in vitro in guinea pig cardiomyocytes. This is probably a result of different mechanical loading conditions and raises questions in the context of mechanically-induced effects [2] on parameters studied in these popular bio-medical models. The software demonstration will illustrate interactive SL measurements in a series of images from in situ and in vivo preparations.
University College London 2006 (2006) Proc Physiol Soc 3, D4
Demonstrations: Guinea pig ventricular sarcomere length in vitro and in situ
Gil Bub1, Patrizia Camelliti1, Gentaro Iribe1, Rebecca Burton1, Christian Bollensdorff1, Peter Kohl1
1. Physiology Anatomy and Genetics, Oxford University, Oxford, United Kingdom.
View other abstracts by:
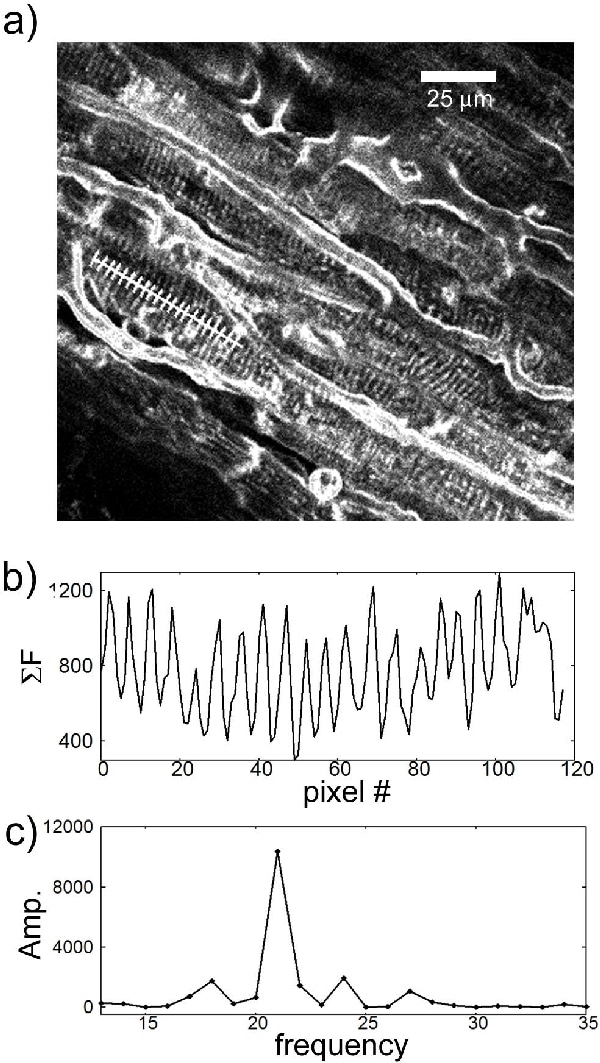
Figure 1. a ventricular tissue scan. b fluorescence intensity profile. c DFT of the intensity profile.
Where applicable, experiments conform with Society ethical requirements.