
Parameters in the Hund & Rudy (2004) canine epicardial (epi) cell electrophysiology model were altered to model differences in isolated endocardial (endo), midmyocardial (M) and epi cell current densities and kinetics, Ca2+ transients, and action potentials (APs), their duration (APD) and rate dependence. Maximal conductances and fluxes were scaled with respect to epi values according to published experimental estimates: the late Na+ current INa,L by 1.15 and 1.7 for endo and M cells respectively; the transient outward K+ current Ito1 by 0.5 and 1.0; the slow delayed rectifier K+ current IKs by 0.9 and 0.3; the Na+-Ca2+ exchanger current INaCa by 0.4 and 0.5; and the Ca2+ uptake flux Jup by 0.6 and 0.7. The time course of reactivation of Ito1 was modelled by altering the slow inactivation time constant to give values of 390, 456 and 264 ms at –80 mV in endo, M and epi cells, respectively. The activation time constant of the M cell rapid delayed rectifier K+ current IKr was twice that in epi and endo cells at all membrane potentials. Computed APs (Fig. 1A) quantitatively reproduce experimentally recorded APs and APD rate dependence (Fig. 1B). When the cell models were incorporated into a 15 mm virtual tissue strand composed of equal fractions of endo, M and epi tissue, electrotonic coupling reduces the transmural APD dispersion, prolongs the mean APD by ∼20 ms, and smooths the gradient in APD (Fig. 1C). The conduction velocity of the depolarisation wavefront is approximately constant throughout the strand. The spatial distribution of repolarisation will be reflected in the ECG T wave. The 3D ventricular wall is heterogeneous, rotationally anisotropic and orthotropic. However, the normal sinus rhythm ensures near-synchronous activation of the endocardial surface and so the excitation wavefront throughout the ventricles approximates a transmural plane wave. The 1D strand is therefore a computationally efficient model of the ventricular wall that can be used to study, for example, the transmural effects of anti-arrhythmic drugs (Aslanidi et al. 2004).
University College London 2006 (2006) Proc Physiol Soc 3, PC91
Poster Communications: A model of canine cardiac ventricular wall electrophysiology
Alan P Benson1, Oleg V Aslanidi2, Henggui Zhang2, Arun V Holden1
1. Computational Biology Laboratory, Institute of Membrane and Systems Biology, University of Leeds, Leeds, United Kingdom. 2. Biological Physics Group, School of Physics and Astronomy, University of Manchester, Manchester, United Kingdom.
View other abstracts by:
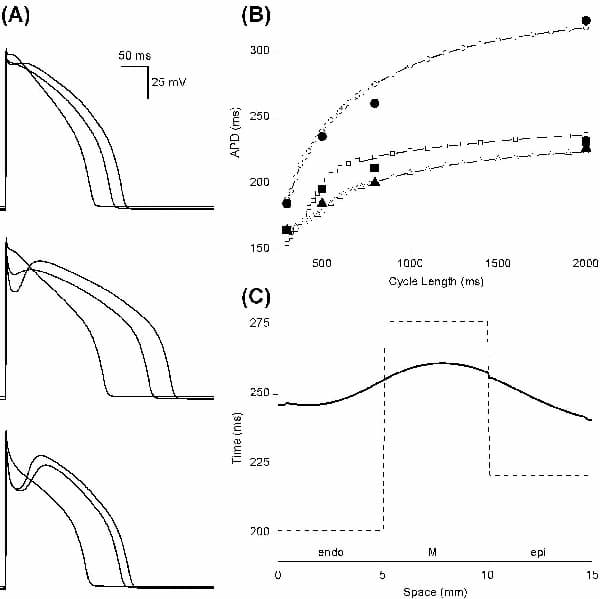
Figure 1. (A) APs in endo (top) M (middle) and epi (bottom) model cells at cycle lengths of 300 800 and 2000 ms. (B) Model APD rate dependence (open symbols) and experimental data (filled symbols from Liu et al. 1993): triangles endo; circles M; squares epi. (C) Transmural distribution of APD (solid line) in a 15 mm virtual tissue strand at a cycle length of 800 ms. Single cell steady-state values for a cycle length of 800 ms were used as initial conditions in the strand which was then paced a further five times. Dashed line indicates APD distribution in uncoupled cells.
Where applicable, experiments conform with Society ethical requirements.