
Physiology News Magazine

High content screening microscopy: It’s all about numbers
High content screening microscopy is a rapidly evolving technology that can be applied to extract rich quantitative information about cell form and function. This article introduces the basic concepts of this powerful imaging modality, and presents a perspective on its current use and possible future direction.
Features
Jeremy Simpson
University College Dublin, Ireland
https://doi.org/10.36866/pn.95.28
Biological imaging has long been a powerful tool for scientists to gain a greater understanding of the world around them. Although sensitive imaging devices such as cameras and photomultipliers are a relatively recent invention in the timeline of biological research, the early pioneers designing and constructing the first microscopes already realised the importance of being able to accurately transpose their microscopy observations into a format that could be appreciated and studied by all.
The first microscopists such as Robert Hooke and Anton van Leeuwenhoek, working in the late seventeenth century, were not only great technical innovators, but also immensely skilled at being able to precisely draw their observations to scale, with an incredible degree of accuracy and detail. The further refinement of microscopes and microscopy resolution through the nineteenth and early twentieth centuries allowed biologists to gain yet further insight into the organisation of cells and tissues, producing micrographs with ever more detail. Two of the great scientists in the latter part of this era were Camillo Golgi and Ramon y Cajal, whose work developing and using stains, for example silver nitrate, allowed the visualisation of cellular distribution in complex tissues such as the brain, in addition to revealing the presence of various subcellular structures, most notably the Golgi complex. Arguably the most impressive aspect of these experiments is the attention to detail in the drawings that were produced, allowing these scientists to already attempt to reconcile cell biology with physiology. However, it has been the introduction of fluorescence which has truly enhanced our ability to understand cell structure and function at the subcellular level. Fluorescence microscopy – and all its variants – is now a mainstream technology found in cell biology, developmental biology, and physiology laboratories around the world. ‘Seeing is believing’ is a phrase widely used in this context, reflecting the power and importance of the image to our understanding of biological systems and structures.
Despite being widely embraced by the scientific community, remarkably fluorescence microscopy has largely remained a qualitative method. This is surprising, particularly from a cell biology perspective, as the complex arrangement of molecules and organelles within cells clearly warrants a quantitative description (Murphy, 2010). The reason for this general lack of quantification is unclear – perhaps researchers believe that simply presenting a fluorescence image of a cell conveys enough information, or that quantification from an image is unnecessarily time consuming or potentially not meaningful. Fluorescence cellular imaging is also a relatively slow process, requiring sample preparation, manual identification of suitable and representative cells, careful focusing and then image acquisition and processing. As such, at first glance, it does not particularly well lend itself as a technique to rapid or systematic analysis of large numbers of samples in a quantitative manner. The sequencing of various genomes, most notably the human genome, potentially serves as a driver to change this perspective. Now we have knowledge of the entire complement of genes and proteins within cells, so surely the time is right to visualise and understand these networks in a truly systematic and quantitative way?
The twenty-first century has seen a remarkable evolution in fluorescence microscopy, as a response to the potentially huge amount of data that knowledge of genomes can provide. Specifically it was realised that manual microscopy – including both image acquisition and analysis – was simply not feasible if cells, their components and pathways were to be studied at a systems-wide level. The response, from a variety of individual laboratories and microscope hardware manufacturers, has been the development of totally automated microscopes (Liebel et al. 2003; Lee & Howell, 2006), equipped with high levels of robotics allowing plate loading, stage movement, filter changing, autofocusing and image acquisition, all without manual intervention. The development of such hardware has also aligned well with the increasing miniaturisation of experiments, with wider use of 96-, 384- and 1536-well plates for biological experiments (Mayr & Bojanic, 2009). The consequence of this evolution, of course, has been that now we are confronted with potentially several thousand or even millions of images – certainly too great a number to be manually assessed, and therefore automated image analysis methods (discussed below) have also had to be developed. Together, this integration of automated microscope hardware, coupled with automated single-cell image analysis routines encompasses the technology that we now term high content screening (HCS) microscopy. This is ever more becoming the method of choice for quantitative systems biology (Pepperkok & Ellenberg, 2006).
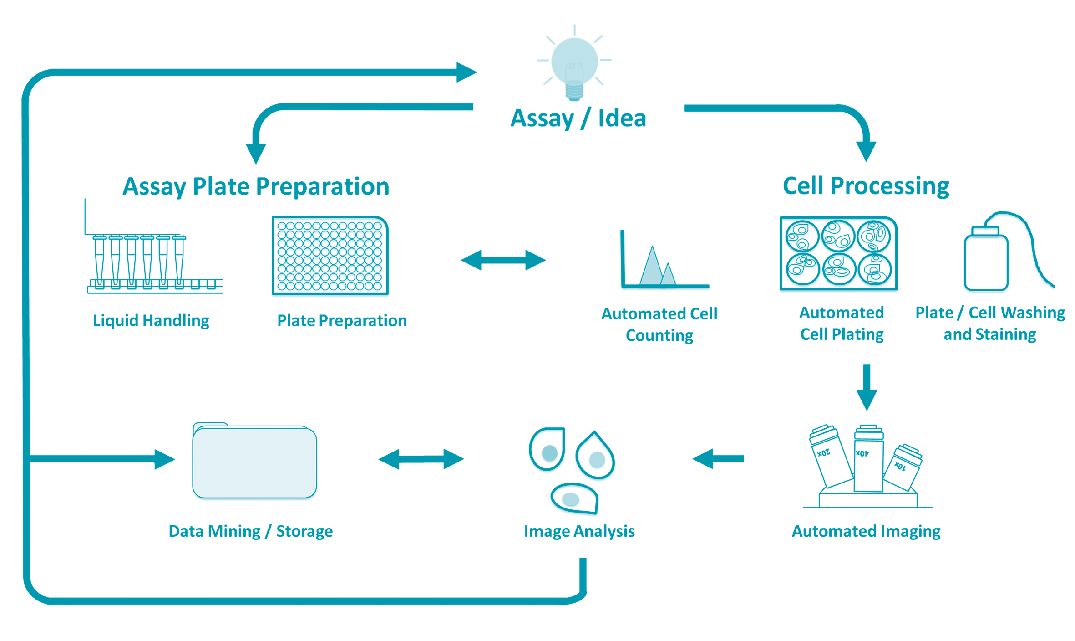
One of the real strengths of HCS microscopy is that it can be applied in a wide variety of biological applications, ranging from fundamental cellular pathway analysis through to drug discovery and testing. The starting point for any HCS regime is the biological assay (Fig. 1). Typically this is an experiment that has been proven to work with samples on an individual basis, or in a manual low-throughput scale. Generally the assay is simple, providing a clear and robust readout that can be easily quantified. The majority of HCS assays are fluorescence based, and utilise either cell lines stably expressing a fluorescent marker, or feature the addition of a fluorescent component (dye or antibody) that acts as a reporter for the assay (Wolff et al. 1996). HCS experiments are usually carried out in multi-well plates, and so robotics, and in particular liquid handling, is often employed at this stage. Plate preparation can include the dilution and dispensing of molecular reagents (such as DNA constructs for over-expression experiments or RNA interference (RNAi) reagents for gene depletion studies) through to chemical compound libraries as would be used in drug/target identification studies. Robotics at this stage can be particularly important, as generally this ensures high levels of reproducibility both across individual plates and between plates. Cells can then be added to the assay plates, and again various levels of automation (for example cell counting and cell plating) can be employed. Once the plated cells have been incubated with the reagents and the assay is complete, the plates are transferred to an automated HCS microscope. The number of images required for a screen is very much dependent on the assay itself and the type of quantification required, but a typical primary RNAi screen for example may involve the acquisition of as many as 20 sub-positions (fields of view) within each well, meaning that from a 96-well plate and in a three-colour assay, a total of 5760 images are collected from a single plate. The next stage in the pipeline is the analysis of the images (discussed below), and the storage and subsequent mining or interrogation of the results. In turn these results are usually used to inform subsequent experimental design and candidate selection.

At the heart of the HCS technology is the image analysis component. Indeed the ‘content’ in HCS refers to the fact that the image requires (quantitative) content to be extracted from it, and to be true HCS this needs to be at the single cell level. It is in this key respect that HCS differs from high-throughput screening (HTS), a similar technology in terms of general approach and throughput, but which has no requirement for extracting fluorescence data from individual cells. The typical first step in HCS image analysis is cell segmentation, often based on the signal in one of the fluorescence channels, and which allows the outline (plasma membrane) of each cell to be recognised (Fig. 2). Most commercial HCS software packages have accurate segmentation algorithms within them, although there are also several good examples of open-source solutions (Fenistein et al. 2008). Following this step it is then usual to identify internal structures within the cells, for example the nucleus and any other membranes of interest that have been fluorescently labelled (Fig. 2). Once relevant structures have been identified they can be quantified. The range of metrics available is now vast, but they broadly fall into three categories – object intensity, object morphology and object texture measurements. Intensity measurements are probably the most straightforward to calculate, with mean fluorescence intensity in a particular region being a relatively well-established HCS parameter. Such measurements have found particular favour with researchers investigating translocation events, for example between the cytoplasm and nucleus. These two compartments are relatively easy to segment accurately, and such assays monitoring changes in fluorescence intensity between them (in response to a perturbation) have been established. A good example of this is an assay to measure quantitatively the translocation of the tumour suppressor protein FOXO (Zanella & Carnero, 2009). Other intensity-based measurements include object and radial intensity distribution metrics, and also quantitative co-localisation of two markers. Morphological measurements include length, width, area, aspect ratio and circularity, and can be applied at either whole cell or subcellular levels. These metrics are particularly powerful to describe quantitatively changes in cell shape and even changes in the organisation of subcellular structures such as focal adhesions (Prager-Khoutorsky et al. 2011). The third category of quantification is object texture feature analysis, which utilises a complex series of algorithms (for example Gabor and Haralick) to highlight patterns and topographical elements within fluorescently labelled objects (Fig. 2). This quantification type is relatively widely used for the analysis of medical images, but is only now gaining traction for the analysis of biological images. It is incredibly powerful however, as it can potentially discriminate subtle cellular phenotypes from very complex images, including from cells of neuronal origin that traditionally have proved difficult to quantify (Wu et al. 2010). Altogether, this is now an exciting time for image analysis of HCS data, and further integration and application of these various methods is eagerly anticipated (Singh et al. 2014).
So what impact has HCS had in the biological sciences and what is its likely future? It is probably too early in the life of HCS to truly appreciate the richness and relevance of data that this imaging modality is giving us; however, HCS has proved to be particularly powerful when aligned with gene depletion studies (Conrad & Gerlich, 2010). HCS in combination with genome-wide RNAi experiments has been used to dissect fundamental cellular events such as endocytosis (Collinet et al. 2010), protein secretion (Simpson et al. 2012), and cell division (Neumann et al. 2010), providing a truly systems-level perspective on how these processes are regulated. HCS also has clear applications in understanding disease and infection (Brodin & Christophe, 2011), and recently has been applied to developmental biology, specifically the study of embryonic morphogenesis (Truong & Supatto, 2011). In the future it is a technology that is likely to be applied to more sophisticated cellular models, including three-dimensional cell assemblies such as spheroids, and also to cells growing in environments that can be tightly controlled, for example in microfluidic devices (Cheong et al. 2010). The image analysis aspects of HCS will also be further refined, which is important if we are to extract more of the rich information that is contained within an image. Those early microscopy pioneers embarked on a great journey of discovery, already then appreciating the importance of producing accurate biological images. This journey now continues – the image remains at the heart of everything, but the scale is now different, meaning that converting image information into unbiased quantitative data is essential if we are to fully understand cell physiology at a complete systems level.
References
Brodin P & Christophe T (2011). High-content screening in infectious diseases. Curr Opin Chem Biol 15, 534–539.
Cheong R, Paliwal S & Levchenko A (2010). High-content screening in microfluidic devices. Expert Opin Drug Discov 5, 715–720.
Collinet C, Stöter M, Bradshaw CR, Samusik N, Rink JC, Kenski D, Habermann B, Buchholz F, Henschel R, Mueller MS, Nagel WE, Fava E, Kalaidzidis Y & Zerial M (2010). Systems survey of endocytosis by multiparametric image analysis. Nature 464, 243–249.
Conrad C & Gerlich DW (2010). Automated microscopy for high-content RNAi screening. J Cell Biol 188, 453–461.
Fenistein D, Lenseigne B, Christophe T, Brodin P & Genovesio A (2008). A fast, fully automated cell segmentation algorithm for high-throughput and
high-content screening. Cytometry A 73, 958–964.
Lee S & Howell BJ (2006). High-content screening: emerging hardware and software technologies. Methods Enzymol 414, 468–483.
Liebel U, Starkuviene V, Erfle H, Simpson JC, Poustka A, Wiemann S & Pepperkok R (2003). A microscope-based screening platform for large scale functional analysis in intact cells. FEBS Lett 554, 394–398.
Mayr LM & Bojanic D (2009). Novel trends in high-throughput screening. Curr Opin Pharmacol 9, 580–588.
Murphy RF (2010). Communicating subcellular distributions. Cytometry A 77, 686–692.
Neumann B et al. (2010) Phenotypic profiling of the human genome by time-lapse microscopy reveals cell division genes. Nature 464, 721–727.
Pepperkok R & Ellenberg J (2006). High-throughput fluorescence microscopy for systems biology. Nat Rev Mol Cell Biol 7, 690–696.
Prager-Khoutorsky M, Lichtenstein A, Krishnan R, Rajendran K, Mayo A, Kam Z, Geiger B & Bershadsky AD (2011). Fibroblast polarization is a matrix-rigidity-dependent process controlled by focal adhesion mechanosensing. Nature Cell Biol 13, 1457–1465.
Simpson JC et al. (2012). Genome-wide RNAi screening identifies human proteins with a function in the early secretory pathway. Nature Cell Biol 14, 764–774.
Singh S, Carpenter AE & Genovesio A (2014). Increasing the content of high-content screening: an overview. J Biomol Screen doi: 10.1177/1087057114528537.
Truong TV & Supatto W (2011). Toward high-content/high-throughput imaging and analysis of embryonic morphogenesis. Genesis 49, 555–569.
Wolff M, Wiedenmann J, Nienhaus GU, Valler M & Heilker R (2006). Novel fluorescent proteins for high-content screening. Drug Discov Today 11, 1054–1060.
Wu C, Schulte J, Sepp KJ, Littleton JT & Hong P (2010). Automatic robust neurite detection and morphological analysis of neuronal cell cultures in high-content screening. Neuroinformatics 8, 83–100.
Zanella F & Carnero A (2009). Adding more content to screening: reactivation of FOXO as a therapeutic strategy. Clin Transl Ocol 11, 651–658.