
Physiology News Magazine

High-resolution displays for high-resolution data
In order to effectively explore the high-resolution datasets being produced by advanced non-invasive organ scanning technologies, it is imperative to use new methods of visualisation. We describe how we have used a tiled wall of multiple LCDs to analyse large biomedical images, from histological sections to three-dimensional (3D) MRI tissue volumes
Features
Christopher Goodyer (1), John Hodrien (1) and Peter Kohl (2)
1: School of Computing, University of Leeds, Leeds LS2 9JT, UK
2: Department of Physiology, Anatomy and Genetics, University of Oxford, Oxford OX1 3PT, UK
https://doi.org/10.36866/pn.76.18

Advances in the technology used for scanning biological samples means that data are being collected at far larger magnification than thought possible, in particular using non-invasive techniques. While providing unprecedented detail, they consist of much larger datasets than have previously been considered. This poses challenges for both the visualisation and analysis.
We describe a collaborative project between the Departments of Physiology, Anatomy and Genetics, the Computing Laboratory, and Cardiovascular Medicine at the University of Oxford, and the School of Computing at the University of Leeds, to develop techniques for high-resolution visualisation of both 2-dimensional (2D) and 3-dimensional (3D) cardiac structure data. Asan exemplar application, we are considering an individual rabbit heart which has been scanned by the group of Jürgen Schneider non-invasively, using high-resolution (11.7 T) MRI giving 25 μm voxel resolution. This heart was then serially sectioned to provide histological images with in-plane pixel dimensions of 0.546 μm x 0.546 μm. The quantity of data from these sets is approximately1.5 GB for the MRI data, and 1.4 TB for the histology stack (see Burton et al. 2006; Plank et al. 2009).
Visual exploration of high-resolution datasets such as these is normally limited by the available display ‘real estate’. The numbers of pixels on a standard computer screen is typically between 1 and 2 megapixels. In contrast, each 2D slice typically consists of up to 32 000 x 32 000 pixels, i.e. more than a gigapixel. The MRI volume for the rabbit heart consisted of 1440 slices with 1024 x 1024 in-plane pixels, i.e. forming about a giga-voxel. Being able to expand the available screen size is therefore very important. However, such expansion must be designed with usability for the end-users in mind.
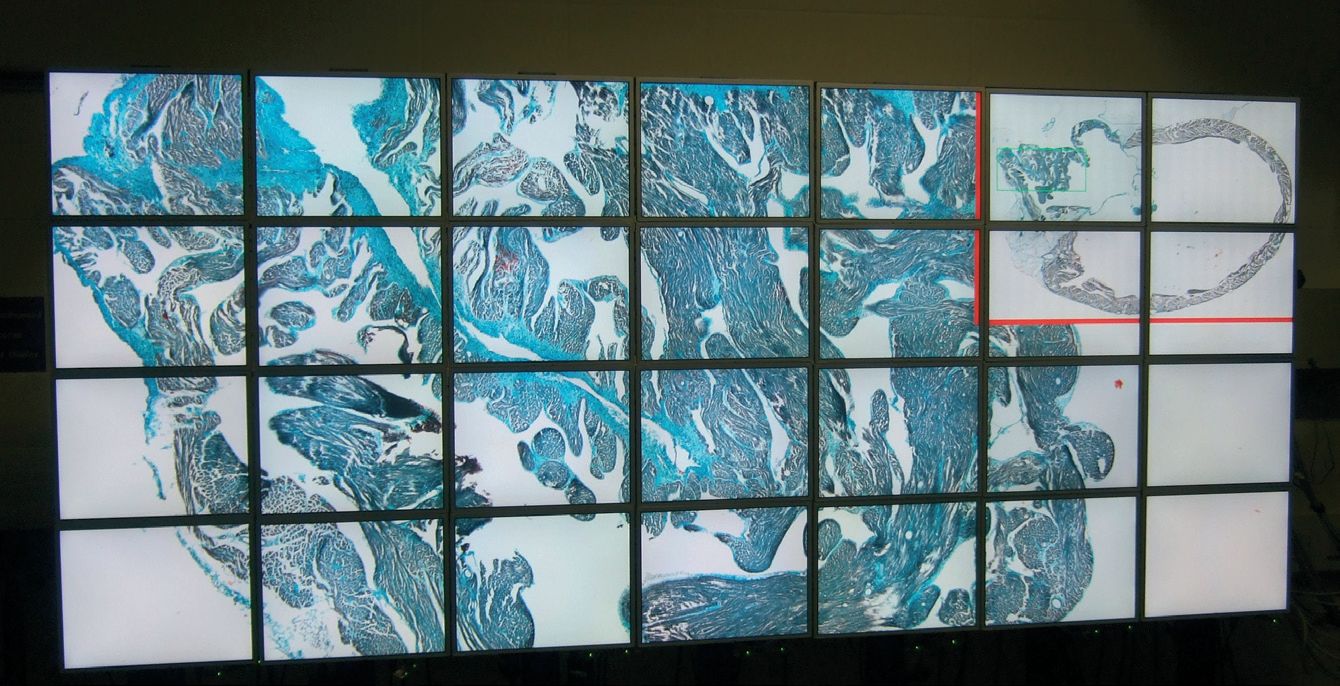
The development of high-resolution display walls, such as shown in Fig. 1, offers a cost-effective way to aid the exploration of extremely high-resolution data. The wall at Leeds (shown) constitutes a total display space of 53.7 megapixels, distributed across 28 LCD panels. Such a display can only be controlled from an interconnected set of computers. The challenge of writing an effective visualisation application to run in parallel on such a computer cluster, and of giving users intuitive and interactive control over the scene, is discussed here. We will illustrate techniques for viewing both 2D and 3D images, but first we address the user control that is common between both applications.
Common features
There are several options available for designing portable parallel visualisation applications that are suitable for tiled displays. We discuss these in Goodyer et al. (2009) and explain our choice of VR Juggler (Bierbaum et al. 2001), both for 2D and 3D viewers. This has allowed us to develop portable software that may be used at multiple sites, currently including Leeds, Oxford and Baltimore, and that may effectively be scaled to varying needs, from desktop systems to display walls, without recompiling.
For navigation in a high-resolution scene on a display wall, it is important that users are free to combine software and physical navigation, i.e. that they can manipulate the displayed data, and walk around to look at different aspects of the image. Using standard desktop input devices, such as a keyboard or mouse, is therefore not practical. Instead we have found that the use of a wireless ‘joypad’ (computer games controller) gives even inexperienced users an intuitive interface for navigation.
Navigation functions provided include zooming, panning, rotation and translocation. By controlling these from the analog controls on the joypad, very fine adjustments of the view are possible. Such changes are not usually possible in ‘on-line’ situations, such as when using microscopes involving lens changes to alter magnification. By eliminating these discontinuities in the view, it aids exploration and cognition of the biomedical data set.
When exploring high-resolution scenes, it is easy to ‘get lost’ in the data. For this reason, we provide an additional thumbnail view in one corner of the wall. This enables the user to navigate the image space, viewing two different zoom levels simultaneously.
The program further allows one to attach alpha-numerical labels to relevant features in the loaded files. These are helpful for repeat viewing, collaboration and teaching. In addition, it is possible to store navigation points, so that the user may ‘jump’ between preset areas of interest. These waypoints can be used to replay sessions and animate presentation between waypoints.
2D viewer
Scanning stage microscopes provide a very powerful tool to image samples with limited user interaction. These microscopes use high-precision stages to translate the sample between microscopic snapshots, which are then ‘tiled’ together to form a continuous high-resolution image of samples that can be much larger than the actual field of view. The smooth zooming operations described above make it possible to obtain pixel-perfect high-resolution images, displayed at whatever magnification is required by the user (Fig. 1).
The scanned images are stored in a pyramid tiled TIFF format, in which the images have been re-sampled at a range of magnifications below the finest level (at which it was scanned). Thus, only the tiles appropriate to each viewing area need to be loaded into computer memory, while – based on the hierarchy of magnifications available – tiles with the next higher or lower resolution can be pre-loaded, so that the user barely notices the change between resolution level. This approach is similar to those used in popular earth-mapping applications that can be run over the internet.
The image viewer has been developed to load images of any size and render them on either desktop or tiled displays. This work is described in greater detail in Treanor et al. (2009) for a related application. The largest image we have tested thus far was 170 000 x 100 000 pixels (or 17 giga-pixels), although there are no architectural limits.
3D viewer
Exploring volumes of data, such as are produced by MRI or CT scans, is becoming increasingly important for clinical diagnoses, as non-invasive imaging modalities are improving in resolution, processing time and affordability. This makes it important to design applications that can exploit perception of 3D structures, as this supports understanding in a way that cannot be obtained by looking at multiple 2D slices of the same volume.
We have constructed a simple isosurfacing operation that produces detailed, but smooth, boundary information from the cardiac MRI data volume described before.
We have used freely available open source tools to do this, and have then performed some small transformations in order to improve the performance of the viewer (see Goodyer et al. 2009 for details). An additional lower resolution representation of all volume data is used during dynamic changes
in display content, to speed up navigation. Once stationary, the high-resolution version of view is shown.
For 3D viewing, additional controls are needed, such as the ability to freely rotate the sample in space. Another addition is the ability to add a ‘clipping plane’, which can be used to ‘section’ the data without moving the viewer’s position. This enables one to ‘strip away’ tissue, to reveal structures that otherwise would be hidden from view.
Of course, surface rendering works best when one views tissue from ‘the outside’. Once a cutting plane crosses tissue and non-tissue areas (such as cardiac muscle and cavity volume), intuitive realisation of the image can be aided by adding texture to tissue, using the original MRI slices. Further off-line segmentation of relevant features of an organ, for example, the cardiac coronary vasculature, can be overlaid and labelled (Fig. 2).

Conclusion
The increasing availability of very high-resolution/very high-volume clinical and research visualisation data sets offers immense benefits for basic science and clinical applications – if they can be visually exploredin a way that takes advantageof the information content and supports intuitive and dynamic user interaction. The technologies required to do so also provide a remarkable tool for education and training. The tools we described here have been developed with cost, efficacy and transferability in mind. Routines have been built for generic applications, rather than a specific dataset. We hope that they will help to support visual exploration of bio-medical data in a seamless and efficient way and we are very happy to work with new research partners.
References
Bierbaum A, Just C, Hartling P, Meinert K, Baker A & Cruz-Neira C (2001). VR Juggler: a virtual platform for virtual reality application development. Proc Virtual Reality 2001 IEEE 89–96.
Burton RAB, Plank G, Schneider JE, Grau V, Ahammer H, Keeling SL et al. (2006). Three-dimensional models of individual cardiac histoanatomy: tools and challenges. Ann NY Acad Sci 1080, 301–319.
Goodyer CE, Hodrien JH, Wood J, Kohl PK & Brodlie KW (2009). Using high-resolution displays for high-resolution cardiac data. Philos Transact A Math Phys Eng Sci 367, 2667–2677.
Plank G, Burton RAB, Hales P, Bishop M, Mansoori T, Bernabeu M et al. (2009). Generation of histo-anatomically representative models of the individual heart: tools and application. Philos Transact A Math Phys Eng Sci 367, 2257–2292.
Treanor D, Jordan-Owers N, Hodrien J, Wood J, Quirke P & Ruddle R (2009). Virtual reality Powerwall versus conventional microscope for viewing pathology slides: an experimental comparison. Histopathology (in press).
Acknowledgements
The data used were kindly provided by the Oxford `3D Histo-Anatomical Heart’ project (BBSRC E003443). Peter Kohl is a British Heart Foundation Senior Research Fellow. We also acknowledge support from the JISC-funded VizNET project and from EPSRC (Integrative Biology e-Science project). Finally, the authors wish to thank Ken Brodlie and Jason Wood.