Physiology News Magazine

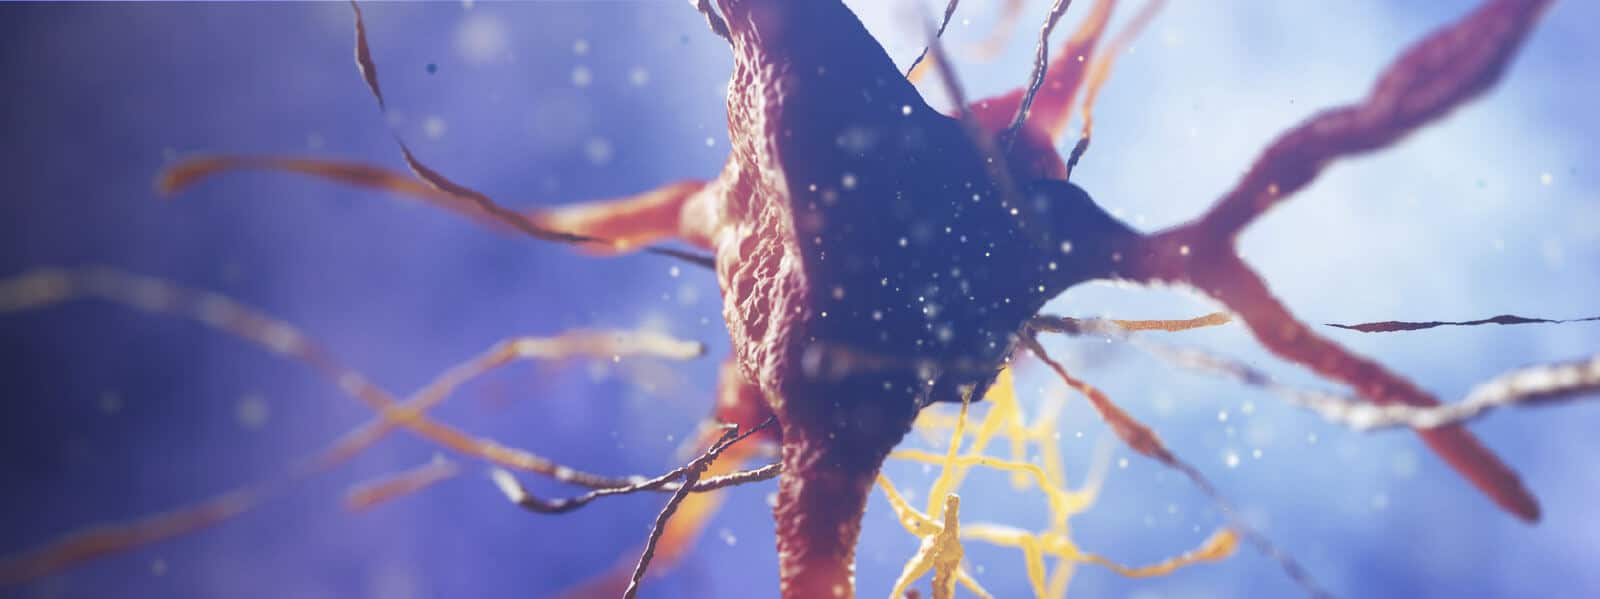
Flavoprotein autofluorescence
Spectroscopic measurements of cellular autofluorescence have a 50 year history, but still have much to give. Here Katsuei Shibuki and Ryuichi Hishida describe an underestimated technique for functional brain imaging
Features
Flavoprotein autofluorescence
Spectroscopic measurements of cellular autofluorescence have a 50 year history, but still have much to give. Here Katsuei Shibuki and Ryuichi Hishida describe an underestimated technique for functional brain imaging
Features
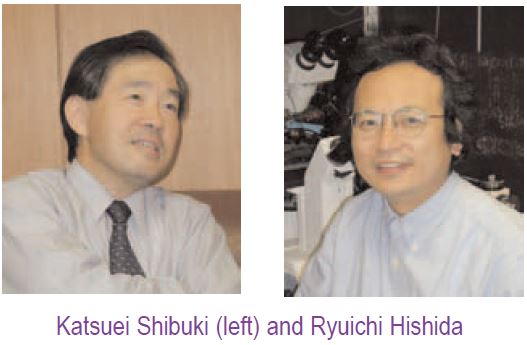
Katsuei Shibuki & Ryuichi Hishida
Department of Neurophysiology, Brain Research, Institute, Niigata University, Asahi-machi, Niigata, Japan
https://doi.org/10.36866/pn.54.18
Optical recording of neural activities is a powerful method for investigating physiological functions of the brain. The technique can be classified into two types: those using extrinsic dyes sensitive to membrane potential, Ca2+ or pH, and those using endogenous signals (Ebner & Chen, 1995). The latter includes so-called intrinsic signal recording based on the intimate coupling between neural activities and oxygen consumption (Frostig et al. 1990).
Although the signal amplitude is small, this method is widely used because it is free from the various problems accompanying the usage of extrinsic dyes. Flavoprotein autofluorescence is another endogenous signal that might be applicable for functional brain imaging (Chance et al. 1962), but has not been applied for functional brain imaging as widely as the intrinsic signal.
About three years ago, we began optical recording in vivo, and used voltage-sensitive dyes for investigating the mechanisms of learning and memory. Unfortunately, we discovered that this method was too delicate for our purposes. We had thought that neural activities in the whole brain might be recorded as Ca2+ signals, because Ca2+ imaging is useful in brain slices. For testing this idea, the surface of the cerebral cortex in an anaesthetized rat was stained with various Ca2+ indicators, and Ca2+ imaging was performed in the slices obtained. To our surprise, green autofluorescence of the slices showed a marked increase in response to electrical stimulation, although the Ca2+ indicators were poorly infiltrated into the brain.
Investigation of previous studies lead us to conclude that the responses were derived from the autofluorescence of flavoproteins, one of the components of the electron transfer system in mitochondria (Chance et al. 1962; Rosenthal & Jöbsis, 1971; Benson et al. 1979). A rise in intracellular Ca2+ triggered by neural activities stimulates oxygen consumption in mitochondria. Activation of the electron transfer system in mitochondria then converts the flavoproteins into an oxidized form, which emits green autofluorescence in blue light. Therefore, by measuring changes in green autofluorescence, we can visualize neural activities. This method turned out to be quite useful for functional brain imaging, not only in slices but also in the whole brain in anesthetized rats (Shibuki et al. 2003). The amplitude of the signal (∆F/F) was 10-100 times larger than that of intrinsic signal recording. The fluorescence signal appeared only 0.1-0.2 s after, and reached a peak only 0.6-0.8 s after, the onset of stimulus in vivo. The signal faded slowly, and spontaneous recovery from bleaching was observed when the excitation light was turned off for a while. These characteristics appear suitable for investigating the mechanisms of learning and memory in the whole brain.
When we first showed our data at scientific meetings, optical recording specialists posed many sceptical questions. This was because flavoprotein autofluorescence had already been known and tested over many years, and the tentative conclusion had been that it might not be good enough for functional brain imaging. So, if it was as good as suggested by our data, why had it not been widely used? We can think of a number of reasons.
First, the body weight of animals used for the recording is critical. We used rats for autofluorescence imaging. We also confirmed that it works well in mice (unpublished data). However, good results were not obtained in cats, dogs or human subjects in preliminary experiments (Table 1).
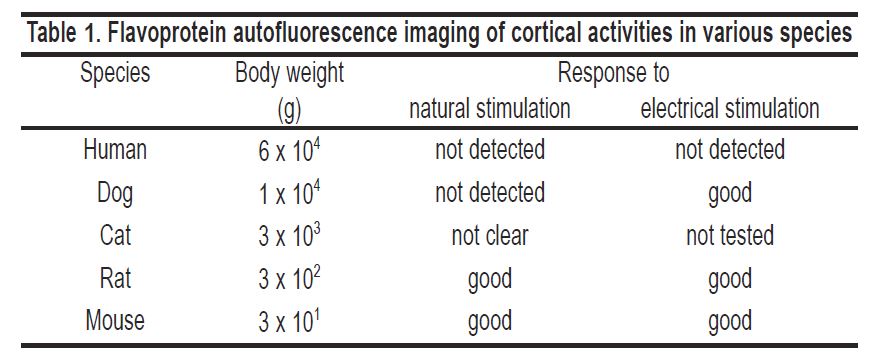
Autofluorescence imaging success in some animal species is partly explained by species differences in metabolic rates per body weight. This parameter is inversely proportional to a quarter power of the body weight (Gillooly et al. 2001). Next, motion artefacts produced by breathing or heart beats are more problematic in large animals. Further, excitation or the emission light used for fluorescence measurement can more easily penetrate through a small brain. Therefore, it is understandable if flavoprotein autofluorescence imaging in animals larger than rats does not produce good results.
The second crucial factor for autofluorescence imaging is the oxygen supplied to the brain tissue, especially in the experiments using slices. We tried to keep the oxygen pressure at the surface of slices emitting autofluorescence as high as possible. In our experiments, slices were placed on a hydrophilic polytetrafluoroethylene (PTFE) membrane filter, which is permeable to oxygenated medium (Fig. 1A). This porous filter becomes transparent in water, because the refractive index of the material is almost the same as that of water.
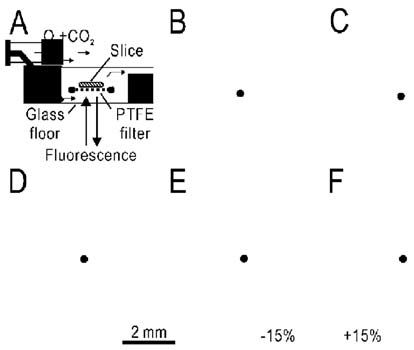
Although autofluorescence responses were clearly recorded in a slice placed on the PTFE filter (Fig. 1B), the same slice directly placed on the glass floor of the recording chamber showed only faint responses (Fig. 1C). The small responses remaining near the pial surface of the slice (Fig. 1C) could be maintained by the diffusion of oxygen from the pial surface. Moreover, we need to be aware that permeability to oxygen differs among various materials. If oxygenated medium was pumped into the recording chamber through stainless steel tubing, clear autofluorescence responses were recorded in a slice placed on the PTFE filter (Fig. 1D,F). However, the same slice showed no response when the medium was pumped through silicone rubber tubing (Fig. 1E). In this experiment, the oxygen level in the recording chamber was reduced to the level of the air, because the silicon rubber tubing is permeable to oxygen.
There are also other important reasons: one is the choice of anaesthetic, because some anaesthetics severely suppress mitochondrial metabolism (Cohen, 1973). We obtained good results using urethane as an anaesthetic but not in rats anaesthetized with pentobarbital. Progress in the development and design of experimental equipment is also important. Obviously, we can today use better cameras and fluorescence microscopes than those used by pioneers in the field of evaluating flavoprotein autofluorescence for functional brain imaging.
Recently, new GFP-based fluorescence probes have been developed for functional brain imaging (Miyawaki et al. 1997). The green fluorescence signals derived from endogenous flavoproteins should be carefully distinguished from those derived from the new probes. However, if both signals are well distinguishable, flavoprotein autofluorescence could be used as a control signal giving information concerning whether the system works well or not.
We think flavoprotein autofluorescence imaging has been underestimated for a long time as a functional brain imaging technique. However, it is a workable method for investigating learning or memory in small animals, particularly in the visualization of cortical activities in mice.
Ultimately, though, the most convincing answer to those sceptical questions posed to us will be the results of future studies using this technique.
References
Benson RC, Meyer RA, Zaruba ME & McKhann GM (1979). Cellular autofluorescence – is it due to flavins? J Histochem Cytochem 27, 44-48.
Chance B, Cohen P, Jöbsis FF & Schoener B (1962). Intracellular oxidation-reduction states in vivo. Science 137, 499-508.
Cohen PJ (1973). Effect of anesthetics on mitochondrial function. Anesthesiology 39, 153-164.
Ebner TJ & Chen G (1995). Use of voltage-sensitive dyes and optical recordings in the central nervous system. Prog Neurobiol 46, 463-506.
Frostig RD, Lieke EE, Ts’o DY & Grinvald A (1990). Cortical functional architecture and local coupling between neuronal activity and the microcirculation revealed by in vivo high-resolution optical imaging of intrinsic signals. Proc Natl Acad Sci USA 87, 6082-6086.
Gillooly JF, Brown JH, West GB, Savage VM & Charnov EL (2001). Effects of size and temperature on metabolic rate. Science 293, 2248-2251.
Miyawaki A, Llopis J, Heim R, McCaffery JM, Adams JA, Ikura M & Tsien RY (1997). Fluorescent indicators for Ca2+ based on green fluorescent proteins and calmodulin. Nature 388, 882-887.
Rosenthal M & Jöbsis FF (1971). Intracellular redox changes in functioning cerebral cortex. II. Effects of direct cortical stimulation. J Neurophysiol 34, 750-762.
Shibuki K, Hishida R, Murakami H, Kudoh M, Kawaguchi T, Watanabe M, Watanabe S, Kouuchi T & Tanaka R (2003). Dynamic imaging of somatosensory cortical activity in the rat visualized by flavoprotein autofluorescence. J Physiol 549, 919-927.