
Computer models have proven invaluable in the understanding of the genesis and conduction of electrical excitation in the atria. However, accurate simulation requires detailed anatomical models. Based on ~1500 images of the rabbit heart obtained by high-resolution MRI using an 11.7 T Bruker MR system (Dr. J.E. Schneider, University of Oxford), we constructed a detailed three-dimensional (3D) mathematical model of the rabbit atria. Custom-written programmes developed in MATLAB (The MathWorks, Inc.) were used to analyse the data and generate the 3D model of the rabbit atria: the ~1500 two-dimensional images were stacked to produce a 3D array with 26.4×26.4×24.4 μm voxels. After cubic interpolation, the array was converted to an isotropic array (30×30×30 μm). Finally, guided by histology and immunolabelling of marker proteins, segmentation of 30 structures was carried out semi-manually using the custom-written programmes. The 3D model of the rabbit atria includes the important anatomical structures for initiation and conduction of electrical excitation in the atria such as the sinoatrial node (SAN), block zone, crista terminalis, the main branch of the crista terminalis, roof bundle, Bachmann’s bundle and the atrioventricular node (AVN; Fig. 1). It also includes the coronary sinus, foramen ovale, left and right atrial appendages, pulmonary veins, central fibrous body, aorta, pulmonary artery, superior vena cava and inferior vena cava (Fig. 1). Interestingly, the rabbit has two superior venae cavae unlike the human heart, which has one. The model is being used to simulate the conduction of the action potential through the atria. For example, we are using it (together with a modified FitzHugh-Nagumo model of the action potential) to determine how the action potential propagates from the SAN to the AVN. The simulations show that the AVN has two inputs: (1) from the SAN, down the crista terminalis and into the AVN via the ‘slow pathway’ and (2) from the SAN, up the crista terminalis, along the roof bundle, down the interatrial septum and into the AVN via the ‘fast pathway’. During sinus rhythm, the second route is faster. This fits well with experimental data from the rabbit heart (Spach et al., 1971).
University of Manchester (2010) Proc Physiol Soc 19, PC205
Poster Communications: A detailed three-dimensional mathematical model of the rabbit atria
G. Hao1, J. Li1, H. Dobrzynski1, M. R. Boyett1
1. Faculty of Medical and Human Sciences, Unversity of Manchester, Manchester, United Kingdom.
View other abstracts by:
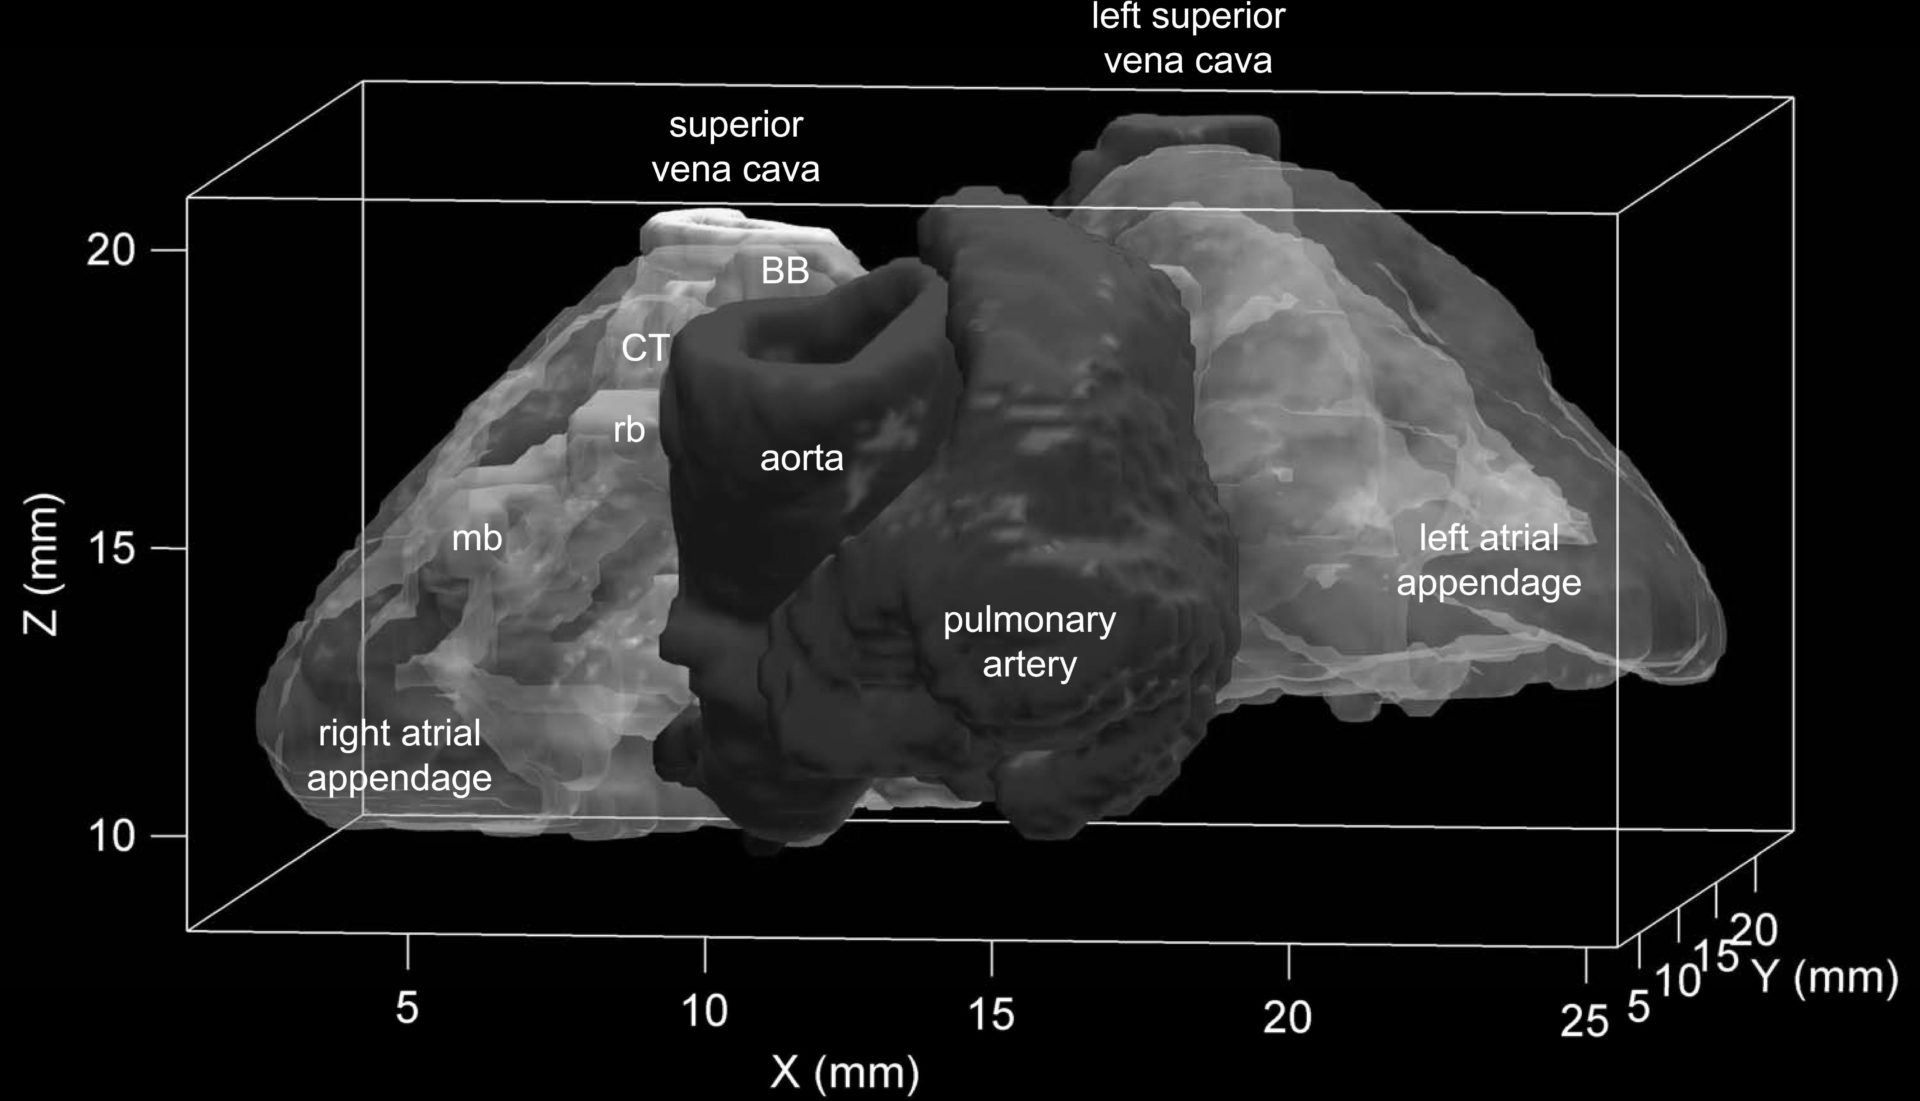
Fig. 1. Ventral view of the 3D mathematical model of the rabbit atria. BB, Bachmann’s bundle; CT, crista terminalis; mb, main branch; rb, roof bundle.
Where applicable, experiments conform with Society ethical requirements.