
The pulmonary vein sleeves (PVS) play an important role in atrial fibrillation (AF) (Nattel, 2002). However, the functional properties of the PVS region have not been well characterized (Aldhoon et al. 2009). In this study, a set of monophasic action potential (MAP) and modified bipolar electrodes and three force transducers were used to simultaneously record MAP and extracellular potentials and mechanical contraction at left and right atriums and PVS region of rabbit heart perfused physiologically in vitro, when the electrical stimulation was applied every ten sinus rhythms with decreasing delay from 200 ms to 0 ms between the tenth depolarization time of right atrium action potential and the stimulation as shown in Figure 1. The results showed that: [i] the mechanical relative refractory period was significantly longer (38±7 ms, 53±9 ms, n=8) at left and right atriums than at the PVS region; [ii] the mechanical absolute refractory period was remarkably longer (12±3 ms, 16±5 ms, n=8) at left and right atriums than at the PVS region; [iii] the delay between the electrical stimulation and contraction was significantly shorter (45±14 ms, n=8) at right atrium than at the PVS region; and [iv] burst pacing (7 Hz) induced atrial fibrillation in the PVS region, but not in the left and right atrial free walls. Therefore, it is concluded that the heterogeneity of functional refractory period at PVS region may facilitate reentry formation as an important factor in the initiation and maintenance of atrial fibrillation.
University College Dublin (2009) Proc Physiol Soc 15, PC30
Poster Communications: Differences between functional properties of atrium and pulmonary vein region
Z. Shui1,2, G. Hao1, Y. Song1, M. Boyett1, J. Liu2, C. Xia2, X. Yang2, Y. Du2, A. Luo3, M. Tang3
1. Cardiovascular Research Group, University of Manchester, Manchester M13 9NT, United Kingdom. 2. Departments of Cardiovascular Surgery and Cardiology, Union Hospital, Wuhan, China. 3. Department of Physiology, Tongji Medical College, Huazhong University of Science and Technology, Wuhan, China.
View other abstracts by:
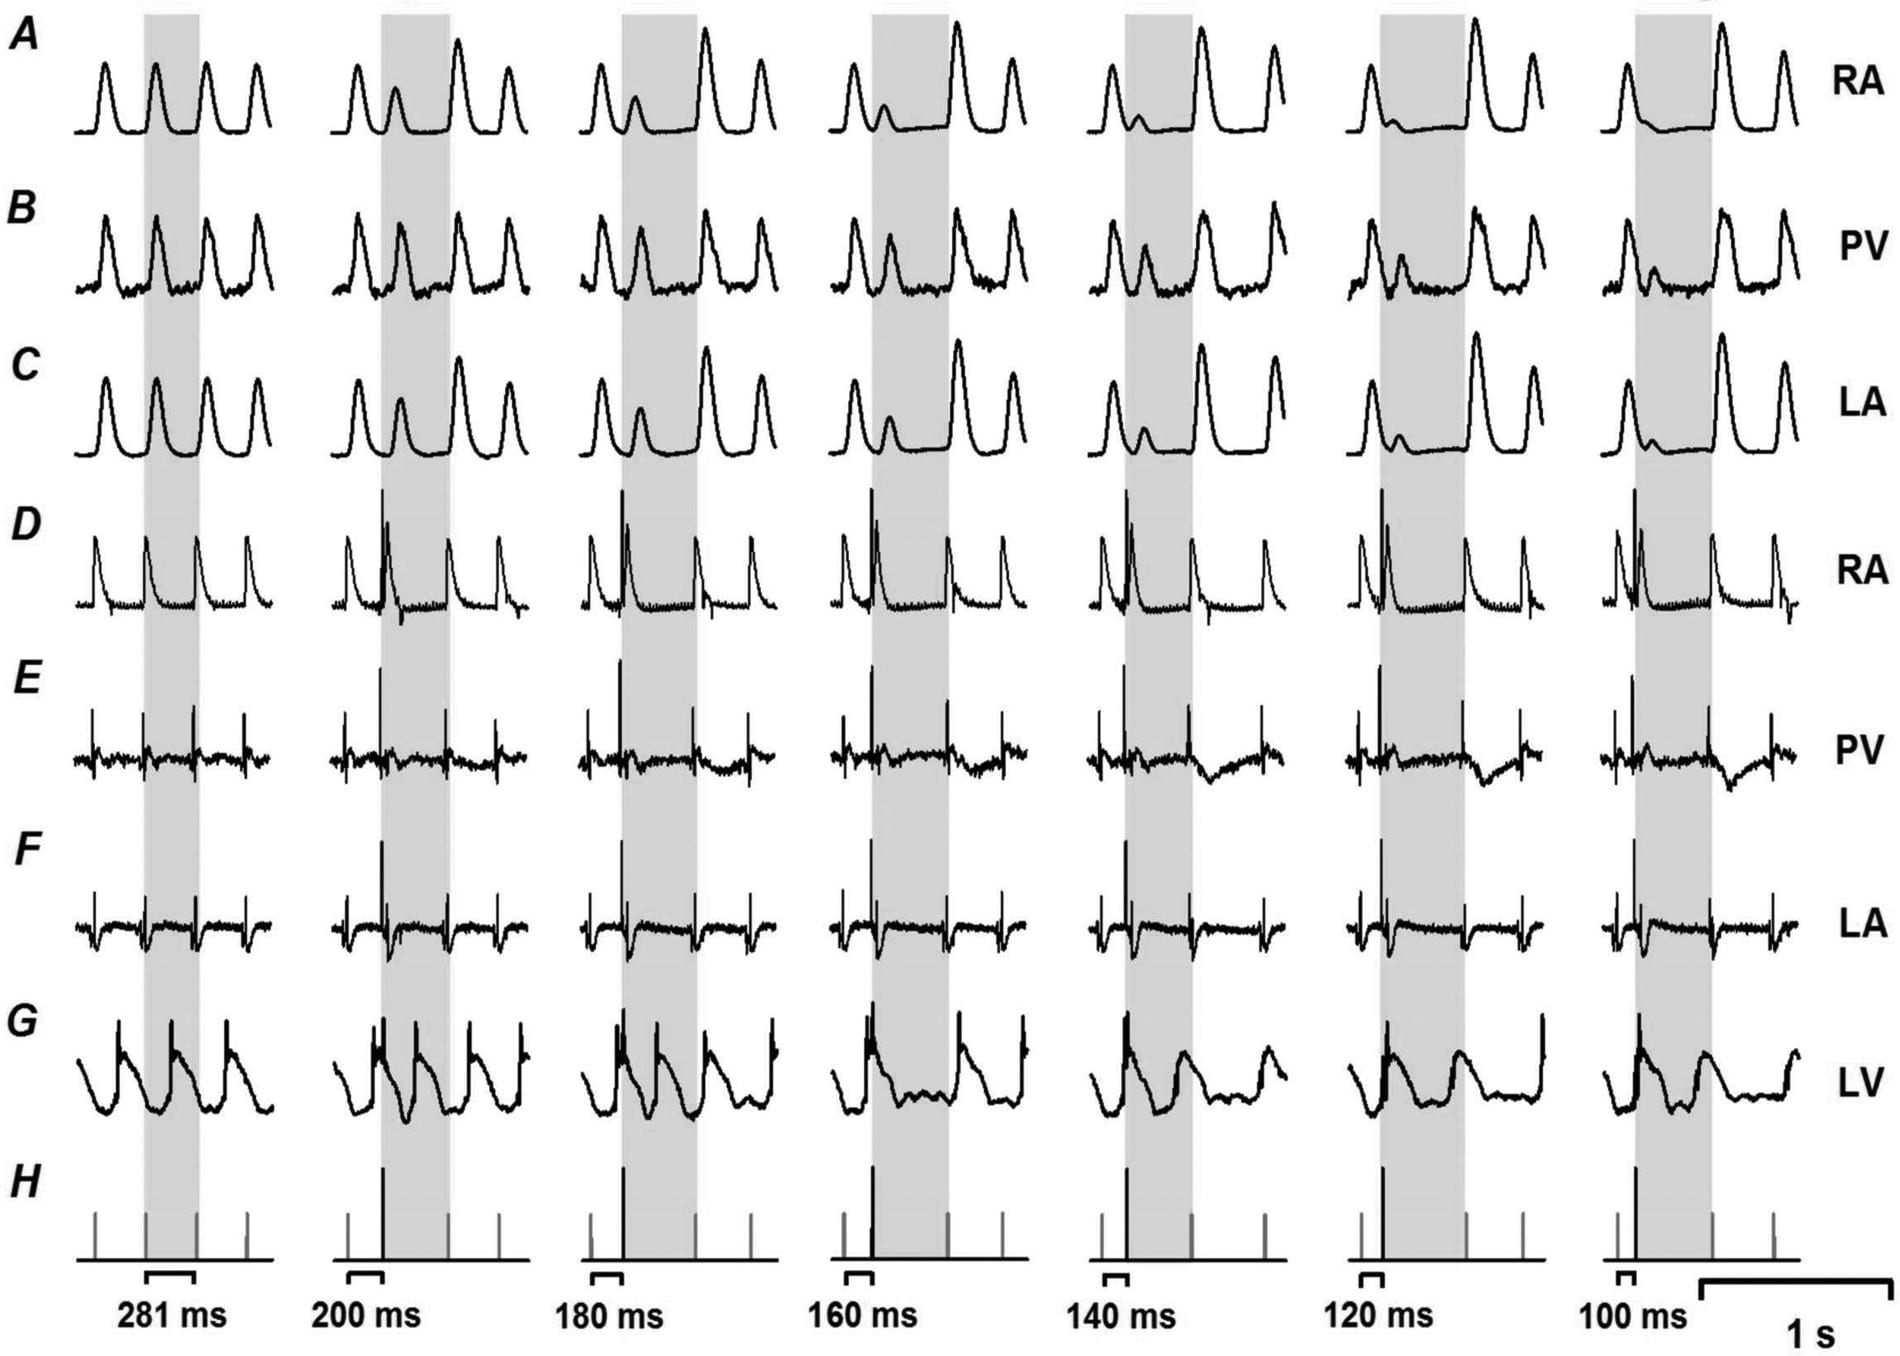
Figure 1. Functional refractory period of atrium and pulmonary vein regionA, B and C, recordings of contraction force of right atrium (RA), pulmonary vein region (PV) and left atrium (LA). D and G, traces of MAP action potential of RA and LV. E and F, bipolar electrograms of PV and LA. H, gray lines indicate the time of right atrium action potential (RAAP) depolarization; black lines with higher amplitude show electrical stimulation at RA.
Where applicable, experiments conform with Society ethical requirements.