
Haemodynamics plays a fundamental role in atherogenesis and thrombosis. Atherosclerotic plaques are known to occur in areas of low wall shear stress and the analysis of the concentration distribution of critical blood species (oxygen, nitric oxide, etc) at these particular points may contribute to understanding the early formation of plaques. A 2D boundary-layer analytical model of advection-diffusion-reaction at the stagnation point on the surface of the endothelium presented by David et al. (2002) has shown that the concentration distribution can be expressed in terms of a similarity function f′(x)=(1/φ(x,0)-1)(Pe Re)1/3/Sh, where φ(x,0) is the concentration along the wall (y=0), Re is the Reynolds number and Pe and Sh are the Peclet and Sherwood numbers, respectively, defined as Re=VL/υ, Pe=VL/D and Sh=KL/D, where υ is the kinematic viscosity, D is the species diffusivity, K is the surface reaction rate of the species, V is a characteristic velocity and L is a characteristic length. We present a 2D computational advection-diffusion-reaction (ADR) model of a flow around a backward facing step to analyse the early stages of atherosclerosis. For species such as oxygen, critically important in the plaque atherogenesis, Pe≥105 and the flow solution of the Navier-Stokes equation represents the input of the ADR model. Further, we use the theoretical analysis to reduce the parameter space and to validate our results extending the dimensional analysis of the stagnation point to the whole lower wall. Our results show the dependence of the flow regime, such as stagnation and reattachment point location, on the Reynolds number and the sensitivity of the ADR model to variations of the Peclet number. Separated flow produces internal concentration layers in the recirculation region which strongly affect the concentration distribution at the lower wall. The interpretation of our computational results shows that the similarity function f′(x) analysis is applicable to the wall corresponding to the entire recirculation region for 50<Re<200 (Figs 1c and 2c). For low Re (<100), the agreement is excellent (Fig. 1c). For high Re, plots for constant Pe illustrate a small disagreement in the recirculation region, which reflects the dependence of the characteristic concentration away from the wall φ(x,∞) on Pe (Fig. 2c). Our results show that, for low to moderate Re, the mass transport along the entire lower wall is governed by the dimensionless parameter (PeRe)1/3/Sh.
University of Oxford (2004) J Physiol 561P, PC17
Communications: DIMENSIONAL ANALYSIS OF COMPUTATIONAL MASS TRANSPORT IN ARTERIAL FLOWS
Radaelli,Alessandro Guido; Sherwin,Spencer J; Peiro,Joaquim ; Doorly,Denis J; David,T ;
1. Department of Aeronautics, Imperial College London, London, United Kingdom. 2. Department of Mechanical Engineering, University of Canterbury, Christchurch, New Zealand.
View other abstracts by:
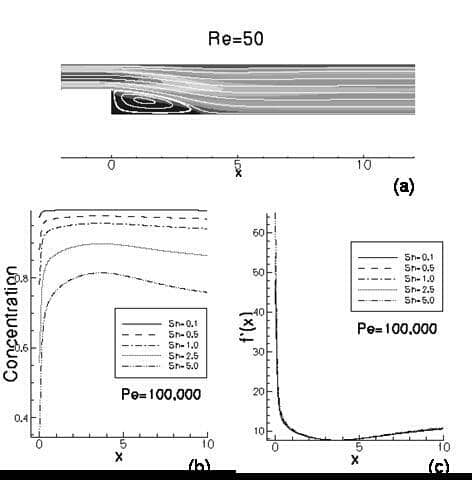
Figure 1: Re=50. (a) Flow velocity streamlines. (b) Concentration plots along the lower wall for varying Sh and Pe=100 000. (c) Similarity function f’(x) for various Sh and Pe=100 000.
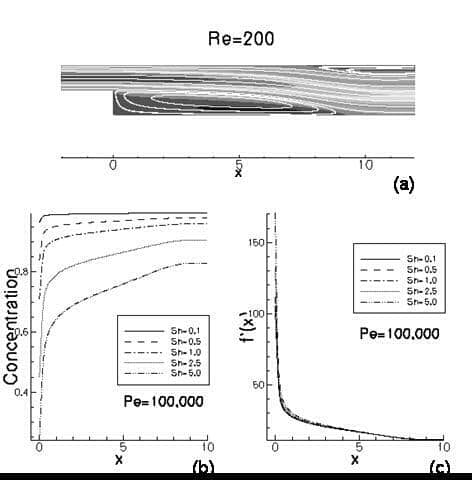
Figure 2: Re=200. (a) Flow velocity streamlines. (b) Concentration plots along the lower wall for varying Sh and Pe=100 000. (c) Similarity function f’(x) for various Sh and Pe=100 000.
Where applicable, experiments conform with Society ethical requirements.