Water is lost continuously from the skin and respiratory system and intermittently lost through urine, faeces and sweat production. Fluid restriction studies to date have typically investigated 24 h of voluntary fluid restriction resulting in hypohydration of approximately 2 % of body mass (Phillips et al. 1984). In the present study, the physiological responses to 37 h of fluid restriction (FR) were compared with those at 13 and 24 h of FR and to a euhydrated condition (EU) of the same duration.
With local ethics committee permission, fifteen healthy volunteers (9 male, 6 female) of mean ± S.D. age 30 ± 12 years and body mass 71.5 ± 13.4 kg were instructed to abstain from ingesting fluids over a 37 h period and were provided with a list of recommended foods with a low water content (Trial FR). On the euhydration trial (Trial EU) subjects maintained their normal diet. Changes in nude body mass were used to indicate the degree of dehydration. Water intake was estimated from dietary records and thirst was assessed using a 10 cm line visual analog scale. Urine was collected for the entire 37 h period in both trials. Plasma volume changes were calculated from haemoglobin concentration and haematocrit (Dill & Costill, 1974). Data were analysed by repeated measures ANOVA, paired t tests and one-way ANOVA and post-hoc Tukey tests where appropriate. Data are represented by means ± S.D. or median (range) (n = 15 unless otherwise stated) with the level of significance set at P < 0.05.
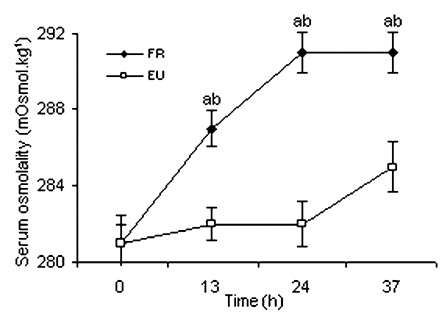
Subjects had losses of 1.0 ± 0.6, 1.8 ± 0.6 and 2.7 ± 0.6 % body mass at 13, 24 and 37 h, respectively, in the FR trial. Urinary losses contributed 1.9 ± 0.4 % of the body mass loss at 37 h in FR. Food intake (n = 14) provided an estimated water intake of 299 (144-721) ml, leaving a 961 ± 401 ml body mass deficit accounted for by respiratory, sweat and faecal water losses. Body mass did not change on trial EU, amounting to a non-significant 0.4 ± 0.2 kg (0.6 ± 0.4 %) decline over the 37 h. The perception of thirst was significantly higher on trial FR at 13, 24 and 37 h (P < 0.05) but did not further increase after 13 h FR (P > 0.05). Plasma volume decreased by 4.2 ± 4.2 and 6.2 ± 5.1 % following the 24 and 37 h FR, respectively. Serum osmolality and serum sodium concentration increased from 282 ± 4 to 291 ± 4 mosmol kg-1 (Fig. 1) and 142 ± 3 to 147 ± 2 mM (both P < 0.05), respectively, but both had stabilised by 24 h. Urine production between 24 and 37 h FR had declined to 25 (11-63) ml h-1 from 50 (16-90) and 34 (20-53) ml h-1 over the initial stages (P = 0.03 and P = 0.09, respectively).
These data show that with 37 h of fluid restriction, dehydration occurs in an almost linear fashion. The unexpected lack of increase in serum osmolality between 24 and 37 h, in contrast to the continuing decrease in plasma volume, may be implicated in the failure to reduce the rate of urine formation sufficiently to overcome the ongoing fluid losses.