
The measurement of the membrane capacitance (Cm) of single cardiac cells is required for normalization of ionic current densities allowing comparison across cell types and species. It is also needed for estimating the fraction of cell membrane located in transverse-axial tubules in cardiac cells and as part of the characterization of cellular hypertrophy. While sophisticated automated techniques are available in recently developed patch-clamp amplifiers, a common approach is still off-line analysis of the current in response to a small voltage-clamp pulse applied from the resting voltage. Experiments were carried out on single ventricular myocytes isolated from male Sprague-Dawley rats under whole-cell voltage clamp. We analysed the biases and errors for two most commonly used methods of Cm evaluation: (a) the method based on least-squares adjustment of the current decay by a single exponential function (with time constant τ) plus offset and (b) the numerical integration of the decaying part of the current. In method b three possible conceptual biases on Cm evaluation are considered: (1) integration is not feasible before a finite time t1 from the start of the charging pulse; (2) neglecting that the voltage across the fully charged Cm is the command voltage multiplied by a factor Rm/(Rs+Rm), that involves finite membrane resistance Rm and non-zero series resistance Rs; (3) a fraction of the charging current cannot be directly integrated. Each of these biases cause underestimation of Cm. A simple method is proposed to recalculate the complete integral from time zero of the voltage clamp pulse. Corrective factors are derived that allow a posteriori compensation of each of the three biases on Cmb estimated by method b, i.e.: factor 1 = [exp(t1/τ)] for bias (1), and a identical factor 2 = [(Rs+Rm)/Rm] for each of biases (2) and (3). The global correction factor [(exp(t1/τ))*((Rs+Rm)/Rm)2] compensates for all three biases. The influence of these biases was studied on capacitance current responses from 923 rat ventricular myocytes to a 10 mV depolarising pulse from -80 mV. In a subset of 520 cells with intact K+ currents, individual estimates of Cm from both methods are compared in Fig. 1. The relative difference (Cma – Cmb)/Cma was –29 ± 9% in ‘nC’, -19 ± 13% in ‘C1’, -7.6 ± 8.6% in ‘C23’, and +4.6 ± 7.8% in ‘C123’. In the remaining 403 cells recorded with blocked K+ currents (not illustrated), these relative differences were, respectively: –10.2 ± 5.0% in ‘nC’, 1.0 ± 4.0% in ‘C1’, -7.8 ± 5.6% in ‘C23’, and +3.7 ± 3.6% in ‘C123’. Thus, application of the global correction factor (exp(t1/τ))*( (Rs+Rm)/Rm)2 compensates for all three biases in method b and yields final Cm values that closely match those from method a. Using a Monte-Carlo approach, a 10 pA rms noise was added to a synthetic capacitance record computed assuming Cm=300 pF, Rs=2 MΩ and Rm=20 MΩ. This was repeated 5000 times, the mean ± SD of estimates of Cm, Rs and Rm were, respectively, 300 ± 0.34, 2 ± 0.002 and 20 ± 0.09 for method a, and 300.1 ± 5.5, 2 ± 0.09 and 20 ± 0.14 for method b. It is concluded that, provided biases are compensated for, with realistic noise levels, and even when resting membrane conductance is large, both methods give equally reliable estimates of Cm.
University College London 2006 (2006) Proc Physiol Soc 3, PC99
Poster Communications: Evaluation of cardiac cell membrane capacitance from the current response to a small pulse. Compared reliability of numerical integration versus fitting an exponential decay
Georges Christe1, Yue Zhang1, Estelle Ricci2, Christophe Chouabe2, Robert Bonvallet2
1. INSERM, Lyon, France. 2. CNRS UMR 5123, Université Lyon 1, Villeurbanne, France.
View other abstracts by:
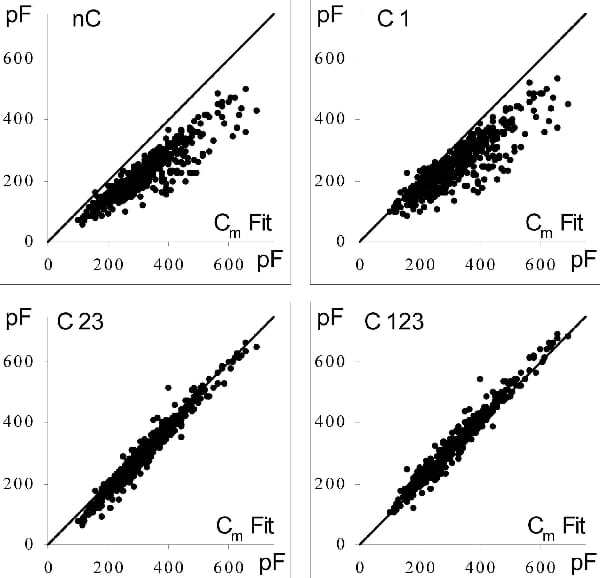
Figure 1. Capacitance charging current responses from 520 cells without blockers of K+ currents were analysed. Cm values from method b (ordinates) were plotted versus those from method a (abscissas). Cm values from method b were uncorrected in panel 'nC' corrected for bias (1) in panel 'C1' for both of biases (2) and (3) in panel 'C23' and for all three biases in panel 'C123'. The solid line is the identity line.
Where applicable, experiments conform with Society ethical requirements.