
Periodic physiological waveform data such as blood pressure and ECG are routinely sampled between 100-1000Hz in preclinical research and in the clinical setting. However, much of the data is disregarded, such that the detail contained within the shape of the waveform is usually ignored and focus tends to reside in only reporting minimum, maximum and rate values. We have developed a novel mathematical method to quantify previously undetectable changes in the cardiovascular system. Our method applies a non-biased approach, taking all of the raw waveform data and plotting it three dimensionally in phase space (using Takens’ Embedding Theorem). This generates an ‘attractor’ which dynamically changes as it tracks through the raw time series data. The 3D attractor is then viewed down one line, reducing it to 2 dimensions. Density is then added to represent variability. Dynamic changes in the size, shape, density and other measures of the attractor, reflect subtle changes in the waveform shape and variability and hence physiological changes of the system. This method provides a unique apporach for quantifying the dynamic changes of the entire waveform increasing the sensitivity of detecting perturbations within the physiological system, which are otherwise undetectable using conventional analysis. In particular, we are interested in ascertaining whether this approach can provide earlier evidence of ensuing clinical deterioration in a patient, facilitating more timely diagnosis and disease management. In the setting of critical care, this could be lifesaving.
Physiology 2019 (Aberdeen, UK) (2019) Proc Physiol Soc 43, SA060
Research Symposium: Extracting new information from old waveforms: Attractor reconstruction where maths meets medicine
M. Nandi1
1. Pharmacology; Drug Discovery Group, King's College London, London, United Kingdom.
View other abstracts by:
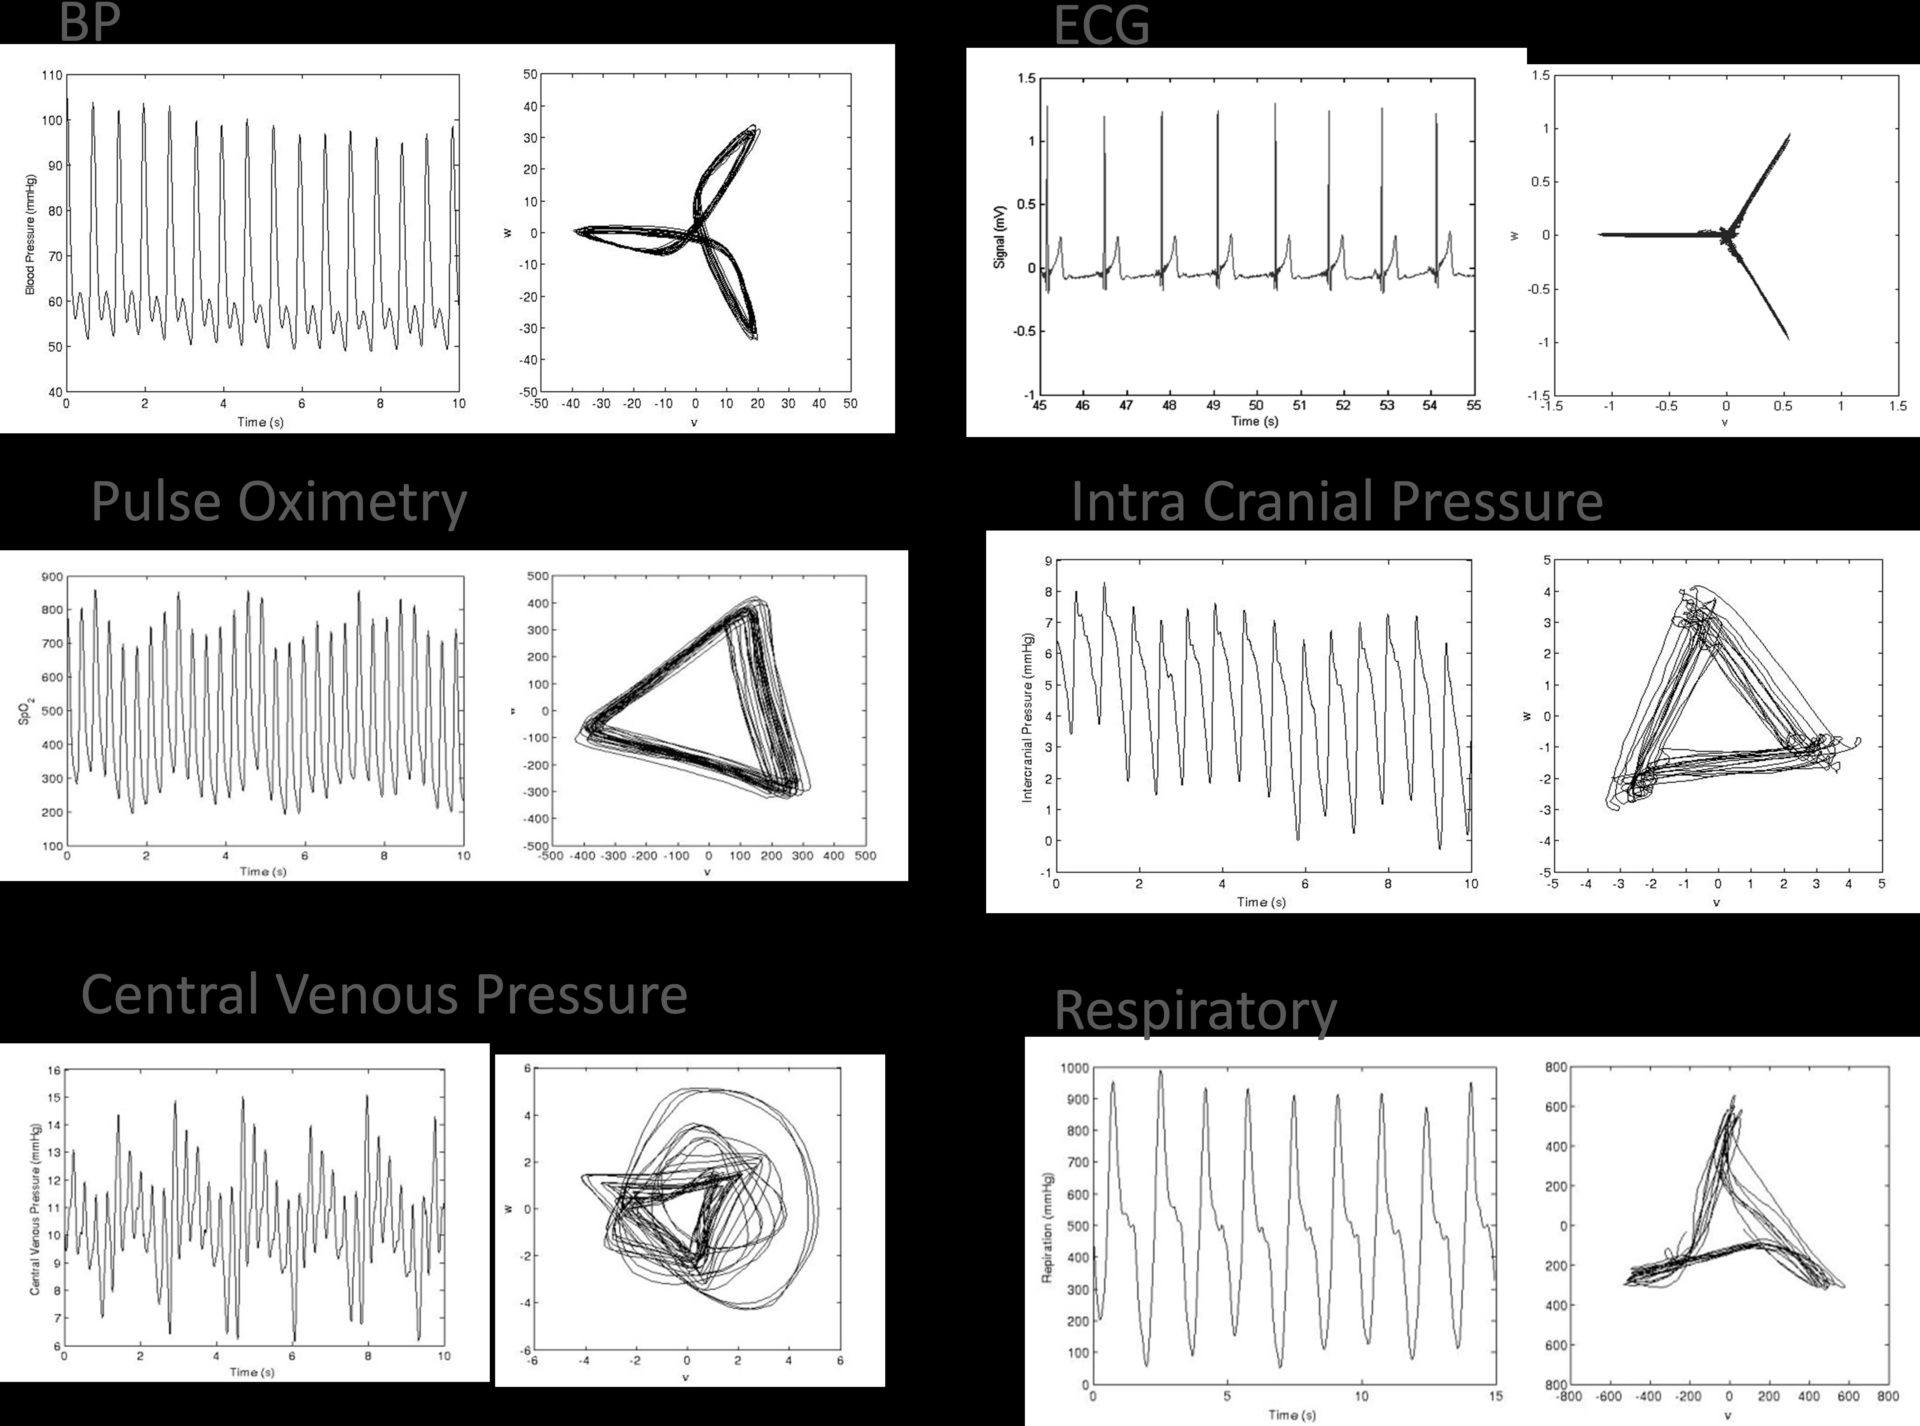
Attractor reconstruction analysis of 6 periodic physiological waveforms from humans: aBlood pressure (BP); bElectrocardiogram (ECG); aPulse Oximetry; aIntra Cranial Pressure; aCentral Venous Pressure and aRespiratory pressure. As the shape of input signal/waveform differs, so each generated attractor is unique and distinct. The attractor tracks through the data over time. Changes in the shape and dimensions of the attractor reflect perturbations in the upstroke and down stroke of the input waveform.Waveform data obtained from: a http//bsp.pdx.edu andb Physionet.
Where applicable, experiments conform with Society ethical requirements.