
During a competitive soccer match there is a net reduction in muscle glycogen, and the exercise intensity is high enough to induce appreciable heat load, causing players to lose up to 3 litres of sweat. The aim of this study was to manipulate the administration of sports drinks during soccer-specific exercise and to investigate the effect on metabolic responses. After providing written informed consent and undergoing familiarisation, 12 male soccer players of mean (±S.D.) age: 24 ±4 years; height: 1.80 ±0.1 m; body mass: 76.5 ± 9) kg; VO2max: 61.08 ± 4 ml.kg-1.min-1 performed a soccer-specific protocol, incorporating static periods, walking, jogging, cruising and sprinting on a motorised treadmill on three occasions. On two occasions either 7 ml.kg-1 BM of carbohydrate-electrolyte (CHOv) or placebo (PLA) solution was ingested 0 and 45 min (538 ± 66 ml; total 1075 ± 132 ml). On a third occasion the same volume of carbohydrate-electrolyte solution was consumed (CHOf) but in smaller volumes at 0, 15, 30, 45, 60, 75 min (179 ± 22 ml). Blood samples were collected at 0, 45 and 90 min and analysed for glucose, glycerol and insulin. Respiratory analyses were undertaken throughout to determine the rate of carbohydrate oxidation (Frayn, 1983). Trials were performed in a double-blind counter-balanced manner. Repeated measures ANOVAs were used to identify differences and significance was accepted at P<0.05. Glucose and insulin concentration (Table 1), and carbohydrate oxidation (PLA: 3.02 ±0.7 g.min-1; CHOv: 3.60 ± 0.8 g.min-1; CHOf: 3.50 ± 0.6 g.min-1) were higher (P<0.05) during CHOv and CHOf compared with PLA and there were no differences between CHOv and CHOf. Glycerol (Table 1) was higher (P<0.05) during PLA compared with CHOv and CHOf. Ingesting carbohydrate-electrolyte solution significantly affected plasma metabolites and increased carbohydrate oxidation. The timing and volume of ingestion did not significantly affect metabolism.
King's College London (2005) J Physiol 565P, PC26
Communications: Fluid Provision and Metabolic Responses to Soccer-Specific Exercise
Clarke, Neil David; Drust, Barry ; MacLaren, Donald Peter Maurice; Reilly, Thomas ;
1. RISES, Liverpool John Moores University, Liverpool, United Kingdom.
View other abstracts by:
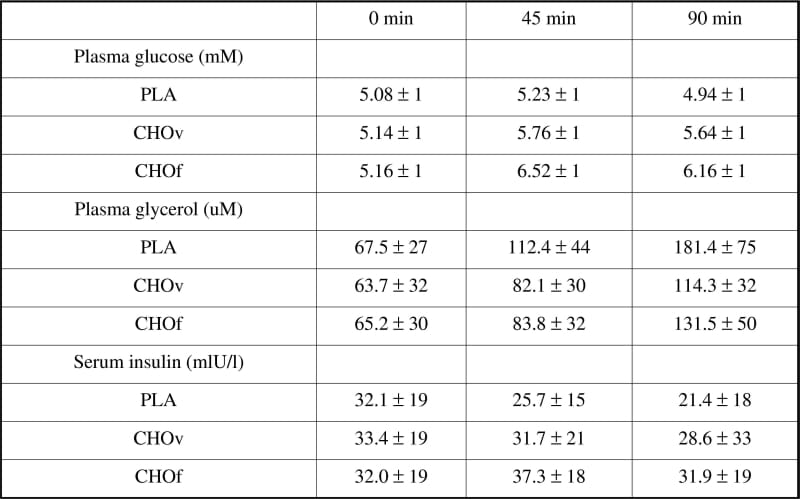
Table 1: Glucose glycerol and insulin concentration (means ± S.D.)

Table 1: Glucose glycerol and insulin concentration (means ± S.D.)
Where applicable, experiments conform with Society ethical requirements.