
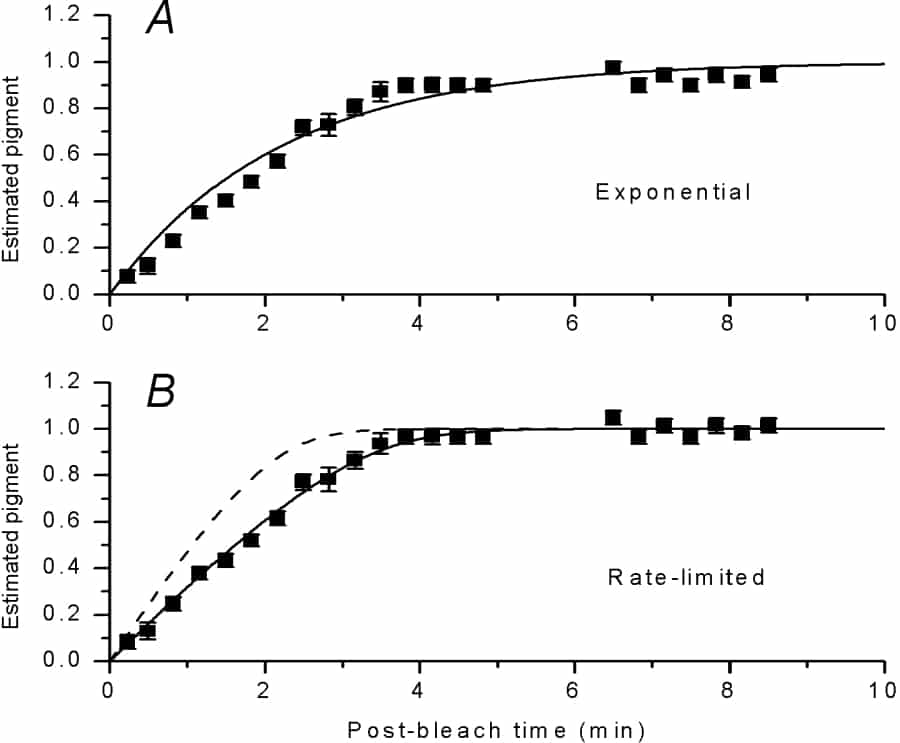
Photopigment regeneration after bleaching can reveal much about retinal function in health and disease. Recently a “rate-limited” model has been proposed, whereby 11-cis retinal diffuses into photoreceptor outer segments through a resistive barrier from a constant pool in the pigment epithelium, resulting in regeneration proceeding linearly with time rather than as an exponential (Lamb & Pugh, 2004; Mahroo & Lamb, 2004). We tested this hypothesis for cone pigment regeneration following very intense bleaches, posing two questions. Does regeneration follow a linear rate after intense bleaches? If so, is the rate the same as for smaller bleaches, as the model predicts? We used a conductive fibre electrode to record electroretinogram photopic a-wave responses to red flashes (0.4 photopic cd m-2 s) following one-minute bleaching exposures (11 000 – 130 000 photopic cd m-2) in two normal subjects with dilated pupils. A blue background (40 scotopic cd m-2), present throughout, eliminated rod signals. Post-bleach response amplitudes were used to estimate pigment regeneration using a transformation published previously (Mahroo & Lamb 2004). Recoveries proceeded according to a linear rate: first order exponentials gave strikingly poorer fits than the “rate-limited” model (see Fig. 1). However, the rate was around 30% slower than that obtained previously from the same subjects following less intense bleaches (Mahroo & Lamb, 2004), suggesting that the model needs modification. Cone pigment appears to regenerate more slowly following very intense bleaches. This may indicate a reduction in the 11-cis retinal pool available, shedding new light on retinal mechanisms after exposure to intense illumination. Figure 1. Cone pigment recovery following intense bleach Fifteen dim red flashes (0.40 cd m-2 s at 0.5 s intervals) were presented every 10 s after 1 min exposure to yellow light of 40,000 photopic cd m-2. Response amplitudes, measured 14-15 ms after each flash, were used to estimate pigment level (Mahroo & Lamb, 2004, Eqn (9) and (10)). Points plot mean ± S.E.M, over 20 s windows, with results from six exposures, so each point averages c.180 flash presentations. Panels fit recovery for a 100% bleach with different models: points differ slightly between panels as fits give different estimated dark-adapted amplitudes, affecting normalization. A, Curve shows best-fitting form of recovery as a single exponential, with time constant of 2.2 min. B, Solid curve: best-fitting recovery according to rate-limited model, giving parameters Km = 0.2 and rate v = 0.33 min-1. Dashed curve: expected recovery if v is 0.5 min-1, which fitted recoveries in this subject from less intense exposures (Mahroo & Lamb, 2004).
University of Cambridge (2008) Proc Physiol Soc 11, PC106
Poster Communications: Human cone photopigment regeneration assessed using the electroretinogram: slower recovery following intense bleaches
O. A. Mahroo1, T. D. Lamb2
1. Physiology, Development & Neuroscience, University of Cambridge, Cambridge, United Kingdom. 2. John Curtin School of Medical Research and ARC Centre of Excellence in Vision Science, Australian National University, Canberra, ACT, Australia.
View other abstracts by:
Where applicable, experiments conform with Society ethical requirements.