
Light adaptation in photoreceptor cells is a prerequisite for normal vision in the vastly variable light intensities found in natural environments. We investigated in vivo how the feedback from large monopolar cells (LMCs) onto photoreceptors modulates this process by recording intracellular voltage responses of photoreceptors in the mutants Vam and ort5. In Vam flies, LMCs 1 and 2 degenerate and ort5 flies are a null mutant for the histamine receptor in LMCs. By repeating saturating light pulses of 4 LEDs, we show that both Vam and ort5 have faster response dynamics (A, inset). From trace 2 onwards, Vam responses are significantly smaller than wild type (Canton S) while ort5 showed no difference to wild type (A, Trace 2, p = 0.00036 & p = 0.65 respectively, t-test), leaving Vam with a smaller voltage range for extra light adaptation. All flies showed a further reduction in amplitude recorded in response to 100 LEDs, highlighting a general lateral inhibitory field effect (B) which was proportionally larger in Vam photoreceptors (C). Both mutants displayed slower repolarisation in response to a long light pulse (D & E, arrows). Vam also lacked a sustained response during the first light pulse (D, asterisk), a phenotype not previously reported in mutants with defective or absent LMCs. Our results provide further evidence that the LMC feedback actively modulates photoreceptor voltage responses1. Without such feedback, the photoreceptors light adaptation is defective, resulting in suboptimal use of response range for coding of visual information. Future work includes ablation of LMCs with ricin using the UAS-Gal4 system. This approach will clarify whether the missing sustained response during the first prolonged light pulse in Vam is solely attributable to a lack of LMCs 1 and 2.
University of Cambridge (2008) Proc Physiol Soc 11, PC2
Poster Communications: Photoreceptor light adaptation is modulated by monopolar cell feedback in D. melanogaster.
P. Gonzalez-Bellido1, T. J. Wardill1, M. Juusola1
1. Biomedical Science, University of Sheffield, Sheffield, South Yorkshire, United Kingdom.
View other abstracts by:
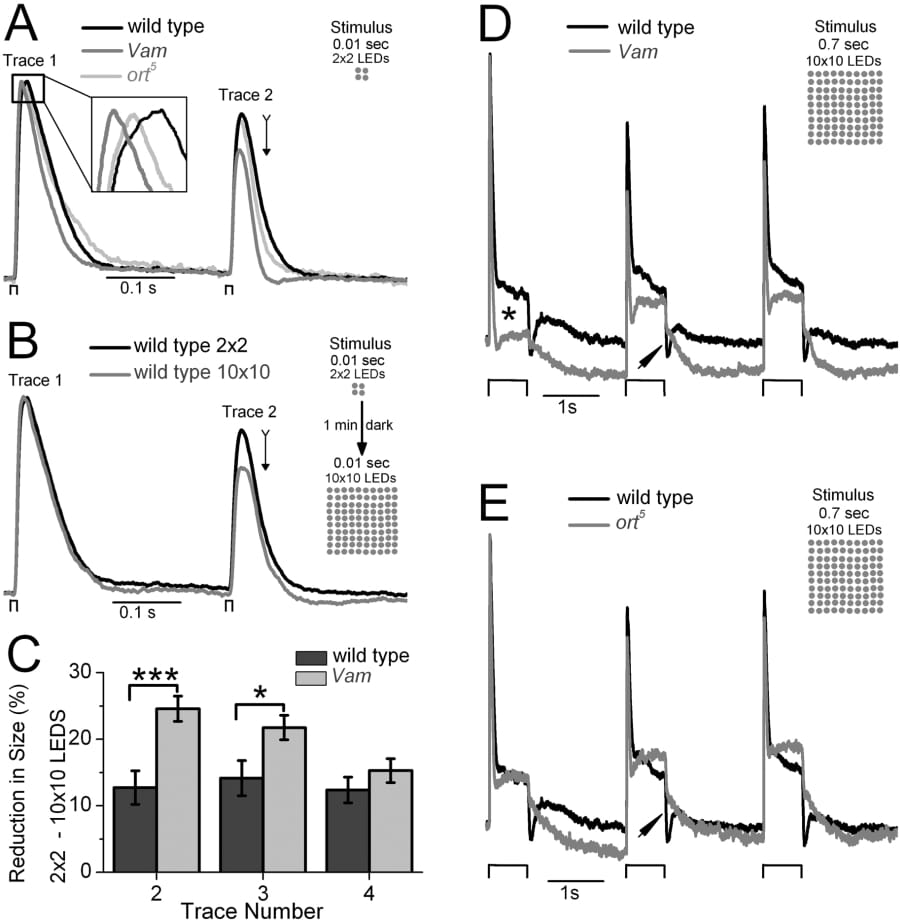
Figure 1. A. Mean of normalised voltage responses from wild type (n = 20 black) Vam (n = 14 dark grey) and ort5 (n = 6 light grey) to stimuli of 0.01 s with 4 white LEDs. B. The thin black arrow indicates differences between the means of normalised wild type responses to 4 (black) and 100 (grey) LEDs with 1 min of darkness between stimuli matrices. C. Bar graphs compare the reduction in normalised responses to trace 1 in wild type and Vam when using 100 instead of 4 LEDs (***p = 0.001 & *p = 0.02669 for traces 2 and 3 respectively t-test error bars = S.E.). Mean of normalized responses to 0.7 s 100 LED stimuli for D. wild type and Vam and E. wild type and ort5.
Where applicable, experiments conform with Society ethical requirements.