
Virtual tissue engineering of cardiac electrical activity requires detailed descriptions of local cell properties – their action potential (AP) mechanisms, local intercellular coupling, spatial heterogeneities, and their spatial and geometric relations. Single cell AP models have been developed for all major regions of the rabbit heart – centre and periphery of the sinoatrial node (SAN) [1], the right atrium (RA), fast and slow pathways of the atrioventricular node (AN and N of the AVN) and His bundle (NH) [2], Purkinje fibers (PF), endocardial (Endo) and epicardial (Epi) layers of the left ventricle (LV) [3] – and validated against experimental data. The single cell AP models are incorporated into a 1D heterogeneous tissue model that includes experimentally reported differences in gap junctional expression between major regions of the whole rabbit heart. Figure 1 shows simulated AP propagation through the rabbit heart at an endogenous SAN driven rate of ~200 beats/min. The AP conduction velocities ranging from ~0.1 m/s in the SAN to 1.5 m/s in the PF correspond to experimental data. The 1D model also produces a pseudo-ECG with feasible P- and T-waves, as well as P-R and Q-T intervals (~75 and 160 ms, respectively) similar to those observed in experiments [4]. In summary, validated cell AP models for different parts of the heart have been incorporated into a simple 1D caricature, and are being incorporated into the detailed anisotropic and orthotropic geometries of the entire rabbit heart (see Benson et al. this Proceedings volume).
University of Leeds (2008) Proc Physiol Soc 10, PC27
Poster Communications: Propagation in an electrophysiologically detailed 1-dimensional model of the whole rabbit heart
O. V. Aslanidi1, R. N. Sleiman1, J. Higham1, S. Inada2, M. R. Boyett2, A. V. Holden3, H. Zhang1
1. School of Physics & Astronomy, University of Manchester, Manchester, United Kingdom. 2. Faculty of Medical & Human Sciences, University of Manchester, Manchester, United Kingdom. 3. Institute for Membrane & Systems Biology, University of Leeds, Leeds, United Kingdom.
View other abstracts by:
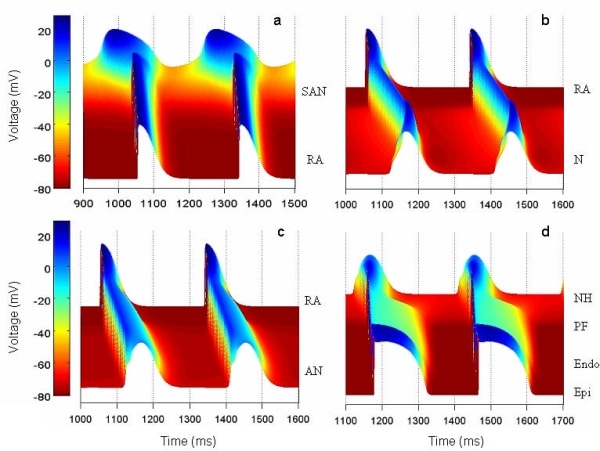
Fig. 1. AP propagation through the heart: from centre to periphery of the SAN and into the RA (a) from the RA into the AVN through slow (b) and fast (c) pathways from NH through PF into the LV (d). AP shapes and durations produced within all regions are similar to experimental recordings.
Where applicable, experiments conform with Society ethical requirements.