Hormone replacement therapy increases adductor pollicis (AP) strength without changing cross-sectional area (CSA) (Skelton et al. 1999). Training also increases strength without commensurate change in CSA (Hisaeda et al. 1996); this suggests similar mechanisms for the effects of oestrogen and of training. To look for interactions between HRT and training we have compared the response of AP to training in three groups of women (post-menopausal non-HRT users, mean age ± S.D. 68.1 ± 6.8 years, N = 8; post-menopausal using HRT, 60.1 ± 7.1 years, N = 14; young, 35.4 ± 6.8 years, N = 7). Subjects were excluded if they had pain or stiffness in movement of the thumb, any generalised neuromuscular disease, or were taking medications likely to affect muscle function or motivation. The study was approved by the RNOHT ethics committee and all subjects gave written informed consent to participate in the study.
Measurements were made of AP maximum voluntary force (MVF) and CSA by the methods of Skelton et al. (1999). Stimulated twitches were recorded during MVF using a magnetic stimulator over the ulnar nerve at the wrist. All measurements were made on both dominant and non-dominant hands. The non-dominant hand was trained for 12 weeks by ten maximal contractions of 5 s duration each day. All measurements were repeated at 3 week intervals.
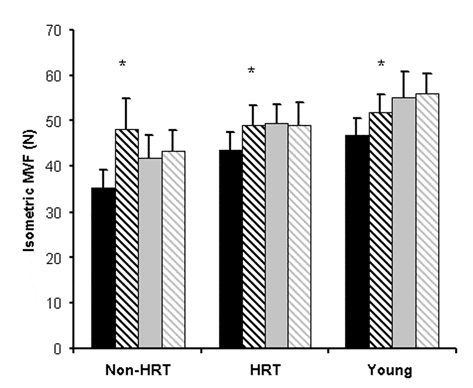
The MVF values before and after the training are shown in Fig. 1. In each group there was a significant increase in MVF in the trained hand (paired t test, P < 0.03). The greatest increase was in the non-HRT group. The rate of increase of strength for each subject was calculated from the five observations made. The mean rates of change (% per week ± S.E.M.) were 2.88 ± 0.61 for non-HRT, 1.42 ± 0.37 for HRT and 0.70 ± 0.34 for young subjects. The differences between groups are statistically significant (P = 0.015, ANOVA).
There were no significant changes in CSA. The mean rates of change were (% per week ± S.E.M.) -0.22 ± 0.19 for non-HRT, -0.21 ± 0.14 for HRT and +0.15 ± 0.28 for young subjects. The interpolated twitch sizes were between 1 and 3 % of MVF and did not change significantly with training. In conclusion, the group with the lowest oestrogen showed the largest training response, as would be expected if the muscle strengthening actions of training and HRT share a common path.

