
The literature reports a large variation in activation capacity (AC), eg 92% (Newman et al. 2003) and 35% (Behm et al. 1995) using the twitch interpolation technique (figure 1). Loring & Hershenson (1992) suggested that the series compliance can affect the twitch force in muscle, but no report to-date has yet systematically studied this possibility. We aimed here to determine a) if tendon compliance might change acutely and b) how this may affect calculations of AC. Twelve healthy young men (aged 27 ± 3.7 years) were tested at 7h45AM and 5h45PM. Patella tendon compliance was determined at a knee angle of 85 deg after the method by Maganaris & Paul (1999). AC of the knee extensors during maximal voluntary contractions was determined by the twitch interpolation method (see figure 1). The investigation was approved by the Manchester Metropolitan University Ethics Committee. All subjects gave written informed consent to participate in the study. Tendon compliance increased by ~ 46.5% (p = 0.0001) from 4084 N.mm-1 (Youngs modulus = 2309 Pa) AM to 2184 N.mm-1 (Youngs modulus = 1235 Pa) PM. This change was in parallel with a 53 ± 20.0 % (p = 0.039) increase in time to relaxed twitch peak and a 37 ± 17.1 % (p = 0.039) increase in interpolated twitch height. The combination of the two latter effects culminated in an AC decrement (13 ± 3.8% (p = 0.019) to 14 ± 4.6% (p = 0.032), depending on whether AC calculation used the ratio of relaxed to interpolated or potentiated to interpolated twitch heights when comparing PM to AM. We propose that the measured lowered AC is an artifact of changes in tendon compliance. In conclusion, our results indicate an increase in time to twitch peak PM, which may reflect changes in the sensitivity of the muscle to electrical stimuli but is most likely due to the decreased stiffness of the musculo-tendinous elements in series with the muscle. This mechanical change is proposed to play an important part in the calculation of activation level.
King's College London (2005) J Physiol 565P, PC29
Communications: Tendon compliance: implications for the measurement of voluntary activation levels
Pearson, Stephen John; Onambele, Gladys ; Bruce, Stuart A;
1. Department of Exercise & Sport Science, Manchester Metropolitan University, Alsager, United Kingdom. 2. School of Biomedical Sciences, Kings College, London, United Kingdom. 3. Directorate of Sport, University of Salford, Manchester, United Kingdom.
View other abstracts by:
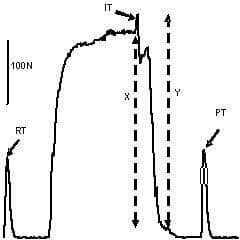
Figure 1. Sample force trace during the activation assessment protocol. Activation level calculations. A) 1-IT/RT. B) 1-IT/PT. C) 1-((Y/X)-1). Where IT is the interpolated twitch RT is the relaxed (unpotentiated) twitch PT is the (relaxed) potentiated twitch X is the total isometric torque preceding an IT application and Y is the total torque at the peak of the IT response.
Where applicable, experiments conform with Society ethical requirements.