
Physiology News Magazine

CO2 emissions of locomotion: innovative automobiles do better than humans
Features
CO2 emissions of locomotion: innovative automobiles do better than humans
Features
Alberto E. Minetti (1) and Gaspare Pavei (2)
1: Department of Human Physiology, University of Milano, Milan, Italy
2: Faculty of Sport Science, University of Milano, Milan, Italy
https://doi.org/10.36866/pn.83.24

Four male friends plan to support their favourite soccer team at the stadium located at the opposite side of the town. Would they emit more CO2 to reach their destination by jogging or by boarding a hybrid car and driving there? Despite the hybrid character of both human and innovative automobile locomotion, modern vehicle technology allows transportation of four passengers (in town) with lower CO2 emissions than if they were running.
Hybrid locomotion in biology and in mechanical engineering
Hybrid vehicles use different energy forms to move around. Petrol-based cars accelerate mainly by converting fuel combustion into mechanical work. During the inevitable braking frequently occurring in town, though, most of the car kinetic speed is not ‘traditionally’ dissipated as heat, but it enters the battery after being converted by an electric motor. That motor is successively used to convert electrical energy back into motion thus, human locomotion and hybrid car technology have something in common.
During walking at constant average speed, humans (and other bipeds/quadrupeds) behave like inverted pendula. The inherent constraint with the ground, causing inevitable raising–lowering and acceleration–deceleration of the body centre of mass within every stride, makes the pendulum an effective strategy to continuously exchange (part of the) body potential energy with kinetic energy. This maintains almost 60% of mechanical energy inside the body, and leaves the remaining 40% to be supplied by the propelling muscles (Cavagna et al. 1963).
Also, the walking cost of transport shows low sensitivity to greater inter-strides speed changes. The mechanics of more ample, multi-stride accelerative–decelerative oscillations can be seen as the cumulative, separate sums of single-step kinetic energy increases and decreases, respectively (Fig. 1A), which can occur at no extra cost with respect to the same ‘constant’ speed, equal-strides walking (Minetti et al. 2001 ). This seems to happen for controlled oscillating cycles of 6 seconds, up to ±40% sinusoidal change of walking speed.
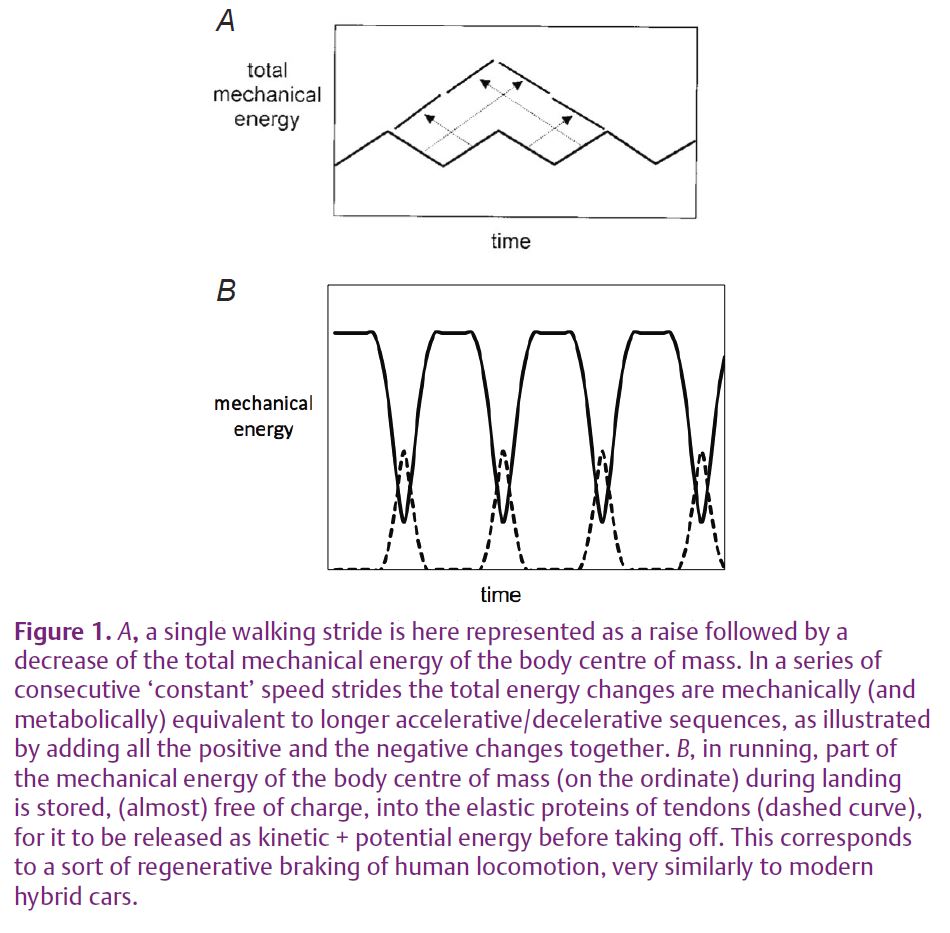
Human running (and legged terrestrial animals trotting/galloping) uses another strategy to keep CO2 emission low. During the first half of the contact phase, part of the inevitable mechanical potential and kinetic energy decrease is temporarily stored into elastic structures, tendons, which release it to power the next take-off, again reducing the work muscles have to provide (Fig. 1B).
Thus, both walking and running dynamics incorporate a sort of regenerative braking, the same strategy of the most modern fuel-saving cars.
Further analogies include the efficiency of muscles (Woledge et al. 1985) and internal combustion engines (Vogel, 1998), about 25–28%, which makes the production of heat and the related water vapour (the most relevant determinant of the greenhouse effect) similar in the two ‘motors’. Tendons and electric motors, namely the hybrid parts in the two ‘vehicles’, also share similar efficiencies (95 and 88%, respectively).
From the metabolic cost of transport to CO2 emission
The carbon dioxide emission of a ‘standard’ male runner can be calculated by knowing his metabolic cost of transport. Experimental measures (di Prampero, 1986) and theoretical models (Minetti, 2004) analysing world records in the distance range of 1 km to the marathon (42.2 km), usually achieved by athletes of about 65 kg mass, lead to a value of about 270 J per metre travelled, independent of the running speed. This has been inferred (Minetti, 2004) by assuming a maximum aerobic metabolic power of 1.9 kW and realistic values of anaerobic energy stores (21 kJ). When we correct the cost of running according to a mass of 75 kg, with a respiratory quotient of 0.9 (corresponding to 80% of the maximum metabolic power sustainable for 2–3 hours) and, consequently, a unit conversion of 20.6 J = 1 ml O2, the production of carbon dioxide is calculated as 13.7 ml CO2 m–1. By considering that 1 mol CO2 (= 44 g) occupies 24,056 ml at standard barometric pressure and at an ambient temperature of 20ºC, the emission of a ‘standard’ male runner is 25.1 g CO2 km–1. In order to compare human to car emission we need to consider four runners, a total of 100 g CO2 km–1 (a reference value we named ECO2R).
CO2 emission per unit distance in fuel-saving automobiles
The most fuel-effi cient car available at present produces about 87 g CO2 km–1, but the reported value refers: (1) to a ‘combined cycle’, which is less expensive than the ‘urban cycle’, and (2) to transporting a load of 180 kg, corresponding to 2.4 passengers. When those data are corrected according to ‘urban’ cycle and 4 passengers, only hybrid car emission is lower than ECO2R (i.e. the 4 runners, see Fig. 2). Their superior economy with respect to competitors (e.g. diesel vehicles) is based on the very low correction factor for the ‘urban’ cycle, since the regenerative brakes and the ‘Stop&Go’ expedient make hybrid car economy less sensitive to the frequent speed changes occurring in town. Today there are about a dozen models on the market and for the most fuel saving of these, the emission is about 95 g CO2 km–1.

Humans vs. automobiles
It seems that we have hit a wall: four passengers in a hybrid car produce less CO2 per unit distance travelled in town than if they all were running. A similar rationale brought David Miller (2008) in this magazine to conclude that running was still marginally less polluting than driving (he used the value of 150 g CO2 km–1 for cars moving at 100 km h–1 on a motorway). It seems a ‘physiological’ coincidence that one of the EU’s goals in terms of containment of pollution is to have automobiles producing just below ECO2R (95 g CO2 km–1) by the year 2020.
Two other interesting limits could be approached in the future, namely four walkers and four cyclists, who are expected to aerobically produce 50 g CO2 km–1 (ECO2W, at 5.5 km h–1) and 25 g CO2 km–1 (ECO2B, at 30 km h–1 on race bikes), respectively (Fig. 2). It is likely that at least ECO2W is within reach by considering that, at the Shell Eco-Marathon 2010 (www.shell.com/home/content/ecomarathon/europe/), an UrbanConcept petrol-driven car designed at the Lycee Louis Delage, Cognac, France, reached a distance of 303 km with 1 litre of fuel (31 g CO2 km–1 when calculated for 4 one-passenger vehicles). In the same event the Polyjoule team from Polytech Nantes University achieved an economy record of 4,896 km travelled with (the equivalent energy from their hydrogen fuel cell) 1 litre of gasoline, corresponding to about 2.8 g CO2 km–1 (calculated for 4 one-passenger vehicles).
Despite all the strategies mentioned to contain the metabolic cost of human locomotion, wheels are wheels are wheels. Our mode of being in contact with the ground forces continuous raise–descent, acceleration–deceleration sequences of the body centre of mass, inherently requiring a signifi cant amount of work, and thus quite a high metabolic energy. However, even after having invented and refined the bicycle, which avoids all those troubles, we are now beaten by (prototypal) technology 9 to 1.
We have mentioned only males, so far, for a reason. The lower average body mass (~10 kg) in women decreases the load factor of cars less than the metabolic cost of running. Four ‘standard’ females still produce during running less CO2 than a four-passenger car, independently of the automotive technology. However, the same ‘green’ attitude of four males in a hybrid car is obtained by extending the female group to fi ve (passengers and runners).
Conclusions
Vehicle science is currently facing a turning point where automobiles, despite their large size, reaching a transport economy challenging our natural gaits (electric-only vehicles already beat ECO2W, although probably due to the lower cost of producing electricity). Arguments against these considerations include air pollution and the non-renewable character of fossil fuels, when compared to foodstuff. However, the cost of processing and delivering foodstuff should also be considered: for the same amount of provided energy, olive oil, for example, ends up being much more expensive (200–300%) than automotive fuels.
References
Cavagna GA, Saibene F & Margaria R (1963). External work in walking. J Appl Physiol 18, 1–9.
di Prampero PE (1986). The energy cost of human locomotion on land and in water. Int J Sports Med 7, 55–72.
Miller D (2008). Jogging and global warming, or the Nike-Adidas CO2 footprint. Physiology News 70, 53.
Minetti AE (2004). Passive tools for enhancing muscle-driven motion and locomotion. J Exp Biol 207, 1265–1272.
Minetti AE, Ardigò LP, Capodaglio EM & Saibene F (2001). Energetics and mechanics of human walking at oscillating speeds. Am Zool 41, 205–210.
Vogel S (1998). Cats’ Paws and Catapults. Penguin Books Ltd, London.
Woledge RC, Curtin NA & Homsher E (1985). Energetic Aspects of Muscle Contraction. Academic Press, London.