
Physiology News Magazine

Single molecule super-resolution microscopy: All for one and one for all
In light microscopy, the ability to resolve two objects from one another is ultimately limited by the physical properties of light. Recent breakthroughs in the field of super-resolution microscopy have overcome this limitation using clever workarounds to localise single molecules.
Features
Matthieu Palayret
University of Cambridge, UK
https://doi.org/10.36866/pn.95.24
All for one: invading the diffraction-limited world
The diffraction limit of light
Microscopes, together with telescopes, have been aiming at increasing their magnification in order to see deeper into the infinitely small or the infinitely large. However, both optical tools are limited by the physical diffraction limit of light as described by Abbe (1873): due to the wave nature of the light, even the smallest point that emits light will be observed as a blurred blob, or point-spread function (PSF) (Fig. 1C and D), with a size approximately half the wavelength of emitted light. This limit is approximately 250 nm in modern optical microscopes (e.g. green light from a single GFP at 500nm). Similarly, the size of a light source (e.g. spot size of a focused excitation laser) is also limited by this same physical restriction. This means that no object below ~300 nm can be directly resolved optically. Electron microscopy solves this issue by using much smaller wavelengths (10–10 m instead of 10–7 m); however it requires fixation of the sample, which kills the sample by physically or chemically altering it.
Two arms in optical super-resolution
Today fluorescence microscopy is a key tool used in many labs and has been proven to be very efficient for observing phenomena in live cells. Two main strategies have thus been developed to overcome the Abbe limit in this field: reducing the illumination of the sample to subdiffraction regions (STED, SIM), or separating in time single molecules that can be localised with a subdiffraction precision (STORM, PALM, PAINT). This article will mainly focus on the latter pointillism techniques. Good reviews for STED and SIM methods can be found in Allen et al. (2014) and Müller et al. (2012).
Concept of single molecule localisation microscopy
The concept behind single molecule localisation microscopy (SMLM) is that the position of an object can be known with greater precision than its size. The size of a table is in the order of metres, but its position can be easily known with a precision of centimetres. Similarly, Newton localised the Earth with a greater precision than its actual size. This is similar with fluorophores. Although they are observed as a 250 nm wide PSF, one can fit the observed blob very accurately with a 2D-Gaussian and localise its centre with great precision (Fig. 1C–G). This precision mainly depends on the pixel size of the camera and the intensity of fluorescent signal (the number of photons emitted by the fluorophore and detected by the camera above the background noise) (Thompson et al. 2002).
However, this trick is only useful if separate PSFs can be distinguished from one another. If the density of labelled proteins brings the proteins closer than the diffraction limit (e.g. protein complexes), then the different single PSFs merge and determining the number of PSFs and the positions of their centres is almost impossible. This is made harder by the fact that the intensity of a fluorophore can vary considerably, depending on its position and its excitation. This means that one cannot simply infer that a PSF twice as bright as another has twice as many labelled proteins.

In order to circumvent this density issue, three labs (Hess et al. 2006; Betzig et al. 2006; Rust et al. 2006) independently published in 2006 different methods which theoretically consist of randomly separating the fluorophores in time so that only a few appear in each frame (Fig. 1A–H). This separation of PSFs in time can be done in multiple ways, using dyes or fluorescent proteins with specific photo-physical properties: some can be stochastically switched ‘on’ and ‘off’ either optically or chemically, either reversibly or irreversibly (fPALM and PALM); some can blink in specific buffers, i.e. go in a long-lived dark ‘off’ state and only switch stochastically back into their fluorescent ‘on’ states for short periods of time, allowing only few to be ‘on’ at any given moment (STORM); some can only emit fluorescence when bound to their ligand (PAINT) (Sharonov & Hochstrasser, 2006). Many methods have already been described, and many more will be, but they all are based on this initial concept.
In a typical SMLM experiment thousands of consecutive images of the sample are acquired, with each frame only imaging a few labelled proteins at a time. The data containing the position and precision of localisation of each protein is then extracted from these images, plotted and merged into a single composite super-resolved image (Fig. 1I–N).
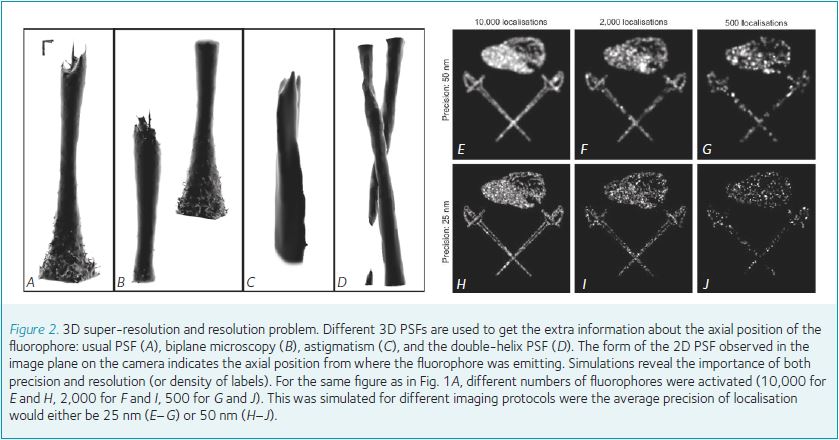
Going 3D
As most biological processes happen in three dimensions, observing their 2D projections is not always very useful. However the depth information of a fluorophore can be obtained from the shape of its PSF. Four main methods have been developed (Fig. 2A–D), listed here following their easiness of implementation and use (or, in the reverse order, on their axial precision): biplane microscopy, astigmatism, the double-helix PSF and interferometric PALM. For example, a cylindrical lens can be inserted into the optical path to introduce an astigmatism causing the round PSF of the fluorophore to become elliptical and the axial position can be obtained from this ellipticity.
They all share the same drawbacks, however; the axial position is gained to the detriment of both precision and resolution (Fig. 2E–J). Indeed, adding extra optical elements, dilating the PSF over more pixels or the increase in out-of-focus noise automatically decreases the signal-to-noise ratio, which is directly correlated to the quality of precision. Similarly, since a volume is then observed, more labelled proteins have to be separated, and an increased sampling is therefore necessary to prevent a decrease in resolution of the final super-resolved picture.
One for all: getting more than subdiffraction resolution
Advantages
Super-resolution microscopy bridges the nanoscopic world of structural biology and electron microscopy with the live cell microscopic world of confocal fluorescence microscopy. It allows observation of proteins at a typical precision of 20 nm in live cells, i.e. a 10-fold better precision than confocal microscopy, without any need to fix the sample. It has to be mentioned that precisions of 0.2 nm in a single dimension were described, through image averaging, and helped to rule out some models of the electron microscopy structure of the nucleopore complex (Szymborska et al. 2013).
By allowing imaging of live cells, SMLM specifically allows observation of moving proteins and study of the diffusion of single molecules in vivo. Single particle tracking is an easy and natural feature that can be added to any SMLM experiment.
Moreover, SMLM methods are relatively easy to implement and use. On the hardware side, a simple but stable total internal reflection fluorescence microscopy (TIRFM) platform together with a 405 nm laser is enough for 2D SMLM. Adding a single cylindrical lens would be enough to gain 3D information for most experiments. On the biological side, many usual fluorophores (such as most of the dyes from the Alexa, Cy or ATTO families) can blink in specific buffers, and primary antibodies (or nanobodies) are commonly used, as are GFP-like fluorescent molecules such as mEos, mDendra or PAmCherry. A last option that combines the brightness of organic dyes to the specificity of fluorescent proteins are the Halo and Snap enzyme systems that are genetically tagged to the protein of interest and accept with a very high affinity a ligand that can be chemically linked to theoretically any dye.
Quantification
One of the least known but major advantage of SMLM is the quantification it brings to the microscopy field. Some fluorophores such as caged dyes or mEos can be photo-activated once and imaged until they bleach. Those fluorophores thus allow counting of the precise number of labelled molecules in a cell, a cluster or a protein complex (Sengupta et al. 2011; Lee et al. 2012). The technique is still in its infancy but is giving interesting results about the stoichiometry of protein complexes in vivo.
Another way of determining the stoichiometry of a protein complex is to localise each of the proteins with higher precision than the size of the complex. To prevent under-counting due to non-perfect labelling efficiency, nanobodies (tiny single-domain antibodies from camelids or cartilaginous fish) with very high affinities have been used to observe the eightfold symmetry of the nucleopore complex (Szymborska et al. 2013).
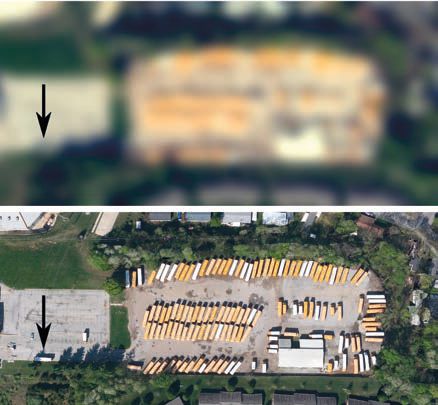
Finally, at the core of SMLM is the ability to track and study low probability events. This is the American school bus problem (Fig. 3): when viewing Earth from space, looking specifically at the actions of American school buses on average over a day (as in bulk imaging), an observer would see them aligned in car parks, static and aggregated. This observation would not help the observer to understand the function of such devices on Earth. However, if the observer could follow only a few buses over one day, he would realise that they leave their static state and very regularly visit the same schools. These tracks would help us understand the role of the school bus. Therefore SMLM can elucidate the functions of rare events much better than bulk imaging (through either confocal or epi-fluorescence microscopy).
Drawbacks
However, SMLM is still in the early stages of development and has a few drawbacks. The first of which is the importance of the signal-to-noise ratio, which is critical in single molecule experiments and thus in SMLM. To increase the signal, very sensitive EMCCD cameras are used together with high-numerical aperture objectives (up to 1.49, in order to get as many photons as possible from each single fluorophore). Both are very expensive. However, a new statistical analysis has recently been developed to use sCMOS cameras, which are cheaper and offer a higher frame rate (Huang et al. 2013).
The signal can also be increased by using the brightest dyes and fluorescent proteins. However, this sometimes comes with drawbacks such as more photo-switching, less specificity, worse labelling efficiency or cell permeability issues.
Finally, decreasing the background noise is also of prime importance. This is done by using labelling protocols offering high specificity (fusion proteins with a fluorescent protein or a Snap/Halo enzyme tag, or very high affinity nanobodies) and by illuminating as thin as possible a region of the sample. Indeed, in epi-fluorescence, since the whole sample is illuminated, the objective collects all the out-of-focus light and the background usually obscures the signal. However, TIRFM is a technique which allows illumination of only 100 nm of the sample above the coverslip. It exploits evanescent waves produced at the site of total internal reflection of light (e.g. rays of light reflected on a lake) to excite fluorophores, the intensity of these waves decreases exponentially when moving away from the surface where the laser strikes. Similarly, a light-sheet system (illumination by a sheet of light about 1 μm thick from the side of the sample) only illuminates the focal plane, considerably reducing the out-of-focus background.

The triangle of compromise
These illumination strategies are also important for both preventing photo-bleaching of fluorophores deeper in the sample and limiting the light damage to the imaged live cell. This underlines the compromise that one has to make for each experiment between the precision required, the speed of the phenomenon to be observed and how robust the live cells are to light damage (Fig. 4). Indeed, to keep cells happily alive, the laser power and the exposure of the cells to the illumination laser need to be decreased. But to get better precision, a higher signal-to-noise ratio is required, meaning higher laser powers and higher exposure (lower frame rate). Finally, to observe a quick phenomenon, the frame rate has to be increased (lower exposure time), but to consequently keep a similar precision, the laser power needs to be increased. Thus, these three parameters have to be carefully considered for each experiment, and a compromise needs to be found.
The future
The field of SMLM is moving towards resolving these drawbacks. 3D microscopy is mostly adopted and standardisation introduced for its most sophisticated forms. Different fourth dimensions are investigated to provide even more information about the single molecules: lifetime, spectrum, dipole orientation, etc. On the hardware side, light-sheets are developed to look deeper into cells and replace TIRFM, quicker and cheaper sCMOS camera are studied to correct for their unequal noise, and adaptive optics are more frequently used to compensate for light scattering and look deeper into samples without losing precision.
On the analysis side, numerous quick and precise software packages have been developed in the last few years (Small & Stahlheber, 2014). There is a focus on the detection of higher densities of fluorophores in order to increase the sampling rate and observe faster phenomena. Also, the integration of the super-resolution data with electron microscopy and structural data is just beginning. Finally, the field is constantly developing still better controlled switchable or activatable fluorophores to increase the accuracy of quantification.
References
Abbe E (1873). Beiträge zur Theorie des Mikroskops und der mikroskopischen Wahrnehmung. Archiv für Mikroskopische Anatomie 9, 413–418.
Allen JR, Ross ST & Davidson MW (2014). Structured illumination microscopy for super-resolution. Chemphyschem 15, 566–576.
Betzig E, Patterson GH, Sougrat R, Lindwasser OW, Olenych S, Bonifacino JS, Davidson MW, Lippincott-Schwartz J & Hess HF (2006). Imaging intracellular fluorescent proteins at nanometer resolution. Science 313, 1642–1645.
Hess ST, Girirajan TP & Mason MD (2006). Ultra-high resolution imaging by fluorescence photoactivation localization microscopy. Biophys J 91, 4258–4272.
Huang F, Hartwich TM, Rivera-Molina FE, Lin Y, Duim WC, Long JJ, Uchil PD, Myers JR, Baird MA, Mothes W, Davidson MW, Toomre D & Bewersdorf J (2013). Video-rate nanoscopy using sCMOS camera-specific single-molecule localization algorithms. Nat Methods 10, 653–658.
Lee SH, Shin JY, Lee A & Bustamante C (2012). Counting single photoactivatable fluorescent molecules by photoactivated localization microscopy (PALM). Proc Natl Acad Sci U S A 109, 17436–17441.
Müller T, Schumann C & Kraegeloh A (2012). STED microscopy and its applications: new insights into cellular processes on the nanoscale. Chemphyschem 13, 1986–2000.
Rust MJ, Bates M & Zhuang X (2006). Sub-diffraction-limit imaging by stochastic optical reconstruction microscopy (STORM). Nat Methods 3, 793–795.
Sengupta P, Jovanovic-Talisman T, Skoko D, Renz M, Veatch SL & Lippincott-Schwartz J (2011). Probing protein heterogeneity in the plasma membrane using PALM and pair correlation analysis. Nat Methods 8, 969–975.
Sharonov A & Hochstrasser RM (2006). Wide-field subdiffraction imaging by accumulated binding of diffusing probes. Proc Natl Acad Sci U S A 103, 18911–18916.
Small A & Stahlheber S (2014). Fluorophore localization algorithms for super-resolution microscopy. Nat Methods 11, 267–279.
Szymborska A, de Marco A, Daigle N, Cordes VC, Briggs JA & Ellenberg J (2013). Nuclear pore scaffold structure analyzed by super-resolution microscopy and particle averaging. Science 341, 655–6558.
Thompson RE, Larson DR & Webb WW (2002). Precise nanometer localization analysis for individual fluorescent probes. Biophys J 82, 2775–2783.