
Physiology News Magazine

Variability: responders, context and noise?
Features
Variability: responders, context and noise?
Features

Bruno Spellanzon & Professor James A. Betts
University of Bath, UK
Life is messy – with many things happening all at once. The response to any given stimulus often depends on interactions with other parameters, not all of which can be measured with great accuracy nor are necessarily very stable. It is therefore understandable why consistent and predictable responses can be elusive, even when making repeated measurements under seemingly standardised conditions. Indeed, variability in observed data should be expected both due to measurement error surrounding the true value and due to natural oscillations in what value is actually “true” at any given time.
One basic-science approach to this inherent variability in nature is to reduce complex phenomena down to isolated cause–effect relationships, which may then be built back up into complete mechanistic pathways. This systematic reasoning undoubtedly has merits but it can also fail to account for all the various confounding variables that may present necessary, sufficient and/or permissive conditions for a given stimulus to elicit the expected responses.
The above thinking is particularly relevant to the field of human physiology and to the increasingly popular concept of inter-individual variability in responses. Specifically, many physiological effects appear to be present only for certain individuals and/or under certain circumstances but not others. It can then be difficult to understand whether the observed variability is attributable to inter-individual differences (i.e. organismic variables), contextual differences (i.e. environmental variables) and/or noise in measurement (i.e. responsivity is random). These are clearly important questions since they directly inform whether and how variability data should be used to help personalise interventions and predict outcomes.
Below we highlight just three experimental design issues that are commonplace in human physiology research and can introduce additional variability in response, which researchers may erroneously construe as evidence of inter-individual differences and the existence of “responders” versus “non-responders”. We will provide specific suggestions in relation to each of these issues, culminating in more general ideas about how to communicate the variability present in data.
Same, same – but different (Standardisation)
One complicating factor when trying to interpret inter-individual differences from the variability evident in human physiological data is that research in this field often adopts a repeated-measures (cross-over) design and tends to involve within-subject standardisation of pre-test controls. In practice, this means that each volunteer completes both the intervention and control arms under matched conditions for their repeated tests (e.g. at the same time of day, same menstrual cycle phase, same evening meal the night before, similar activities the day before, etc.). Critically, however, these conditions are not necessarily matched across the different volunteers in the study (i.e. no between-subject standardisation). With this common form of experimental design and controls, no matter how many times the intervention and control arms are replicated, any prediction that a given person is a “responder” or “non-responder” may in fact be dependent on the unique context of their test rather than some personal characteristic specific to that individual (i.e. participants may all respond more similarly if everyone adhered to the same pre-test controls). Whilst using greater between-subject standardisation can therefore help identify-individual responsivity, this can also be at the expense of generalisability since group level effects are all then observed specific to a particular context.
What did you say – what did they? (Communication)
Scientific papers reporting human physiological data rightly tend to provide intricate detail regarding objective methods information, such as the exact equipment/apparatus used, calibration procedures and how samples were collected/analysed. However, an absolutely critical but regularly overlooked element of methodological reporting in human physiology is the more subjective account of how researchers communicate study information to volunteers. This mismatch perhaps occurs because the mindset of researchers who tend to think more quantitatively about controlling variables is not usually the same as that of the researcher who tends to think more qualitatively about how human volunteers may interpret or experience a research study.
There is a vast body of evidence from a range of fields showing how individual interpretations of the same message can lead to different outcomes. For example, a person’s political affiliation can dictate whether they perceive information in the media to be factually correct (Michael and Breaux, 2021), whereas an individual’s cultural and educational background can profoundly influence their understanding of medical advice (Graham and Brookey,2008). In relation to human physiology research, one example might be an appetite study utilising an ad libitum meal test, in which volunteers are presented with an unlimited supply of food and asked to “eat until you feel full”. Volunteers are presumably expected to understand that the study is about the physiological mechanisms of appetite regulation (e.g. stomach distension and satiety hormones) and so eating should continue until hunger has been satisfied. However, some may well perceive the message about “fullness” in terms of there being no more space in their stomachs (similar to a “full” battery or fuel tank) or even consuming the amount of food they would consider to be a “full” (i.e. large/main) meal.
Beyond the above laboratory-based example, similar differences in interpretation are also relevant for field-based physiological studies in which there is potential for free-living volunteers to react (or not) to a prescribed intervention. For example, in response to a prescribed dietary intervention, are participants free to spontaneously modify physical activity levels as comes naturally? Far too often this type of research does not provide adequate guidance to volunteers about whether compensatory lifestyle changes in response to the intervention are permitted (or at least any such guidance does not form part of the published report, yet is absolutely central to understanding the research findings).
It only takes a minority of research volunteers to interpret study requirements differently to the intended meaning understood by others for there to be increased variability in response – possibly leading to (mis) classification of some individuals as distinct “responders”. Researcher communication and participant interpretation therefore clearly matter and, especially when considering inter-individual variability, studies involving human volunteers should: carefully consider and standardise the precise wording of participant information (perhaps using written or audio-recorded statements); verify each individual’s understanding of that information (perhaps asking them to repeat it back in their own words); and thoroughly detail these communications in the published report of the study.
The more things change – the more they stay the same (Familiarisation)
Another specific issue that occurs more in human physiology than some other fields of research is the potential for trial-order effects of one kind or another. For example, clinical trials more frequently employ independent/ parallel groups designs (i.e. no repeated testing) and/or involve a more innocuous one-off assessment of a given outcome at follow-up (i.e. no lasting effects between repeated measurements). By contrast, many basic science questions in physiology tend to involve relatively extensive, invasive and/or repetitive assessments, such that systematic changes in outcomes over time can occur due to inadequate recovery from previous tests (e.g. fatigue) and/or some form of familiarisation with those tests (e.g. adaptation or learning).
An informative example might be an investigation into whether antioxidant vitamin supplementation confers protection against exercise-induced muscle damage. As we all know from personal experience, unaccustomed physical exercise can result in muscle pain the next day (commonly known as delayed onset muscle soreness). This tenderness results from the initial mechanical strain of muscular activity, combined with a secondary chemical injury due to oxidative= stress and subsequent inflammation (Pyne, 1994), thus providing the rationale for examining dietary antioxidants. Let’s therefore imagine a study in which habitually inactive individuals ingest a daily vitamin E supplement (or placebo) for one month, before completing intense exercise and then rating their perceived soreness 24 hours later. This will be a fully randomised and counterbalanced experiment using a simple 2-by-2 AB/BA cross-over design – meaning that all volunteers will do the exercise test on two occasions separated by (say) one month: once following vitamin E supplementation and once following placebo supplementation (with half receiving vitamin E first and half receiving placebo first).
The reason for selecting this particular example is that both exercise-induced muscle damage and vitamin supplementation introduce separate issues for a cross-over design that can interact to present major challenges during analysis. Firstly, it is well-established that eliciting exercise induced muscle damage on a single occasion imparts a marked degree of resistance to the damaging effects of similar exercise in the future – an adaptive response that can last at least 6 weeks (Byrnes et al., 1985). This type of period effect therefore results in a consistent change in outcome measures from the first to the second test (irrespective of the sequence of treatments), potentially due to some difference between baseline and follow-up either in the participants, in the conditions of the study, or in the calibration of measurement tools. Whilst not ideal, this effect should influence both sequences AB and BA similarly (provided that the experiment was counterbalanced), so it may be possible to adjust the analysis of a straightforward AB/BA cross-over in order that the effect of treatment can still be estimated (Dwan et al., 2019).
Secondly, it is also well-established that lipid-soluble compounds such as vitamin E exhibit a relatively slow intracellular turnover and can accumulate in various tissues (e.g. adipose, adrenals, liver and muscle; Packer, 1992), meaning that supplementation ahead of the first test may result in an increased antioxidant status that persists through to the second test. This form of carry-over effect therefore results in a treatment effect that depends on the sequence of treatments (commonly due to an inadequate “wash-out” interval before repeated tests), which can be further complicated if for example one treatment already works more effectively when applied in either the first or second test (i.e. a treatment*period interaction). Unfortunately, in this instance there is currently no accepted remedy to tease apart the carry-over and interaction effects via post-hoc statistical analyses (Senn, 2002), so these effects can confound interpretation both of the primary analysis at a group level and of variability analysis at an individual level (e.g. identifying certain individuals as “responders” when their apparent responsivity depends entirely on the sequence of treatments).
It is therefore advisable to carefully consider the likelihood of carry-over/interaction effects at the experimental design stage. The above example demonstrates that neither randomisation nor counterbalancing does anything to prevent the treatments or measurements involved during an initial test from exerting a lasting or even permanent influence on future tests. Instead, if it cannot be confidently assumed that measurements will be stable across repeated tests, pre-emptive solutions could include: allowing an adequate washout interval between tests; recruiting a population who are already accustomed to the tests (possibly by familiarising them with preliminary tests); or using an independent/parallel groups research design (possibly a Solomon Four-Group Design if within-subject contrasts are integral to the research questions).
Show me the data (Visualisation)
As is generally the case for effective results reporting, when considering variability there really is no substitute for full and transparent presentation of individual data. Thoughtful visualisation can convey numerous aspects of the underlying information, complement and inform any more formal statistical analyses, and enable others to further interrogate the source data using whichever analytical approaches that may be preferred in future.
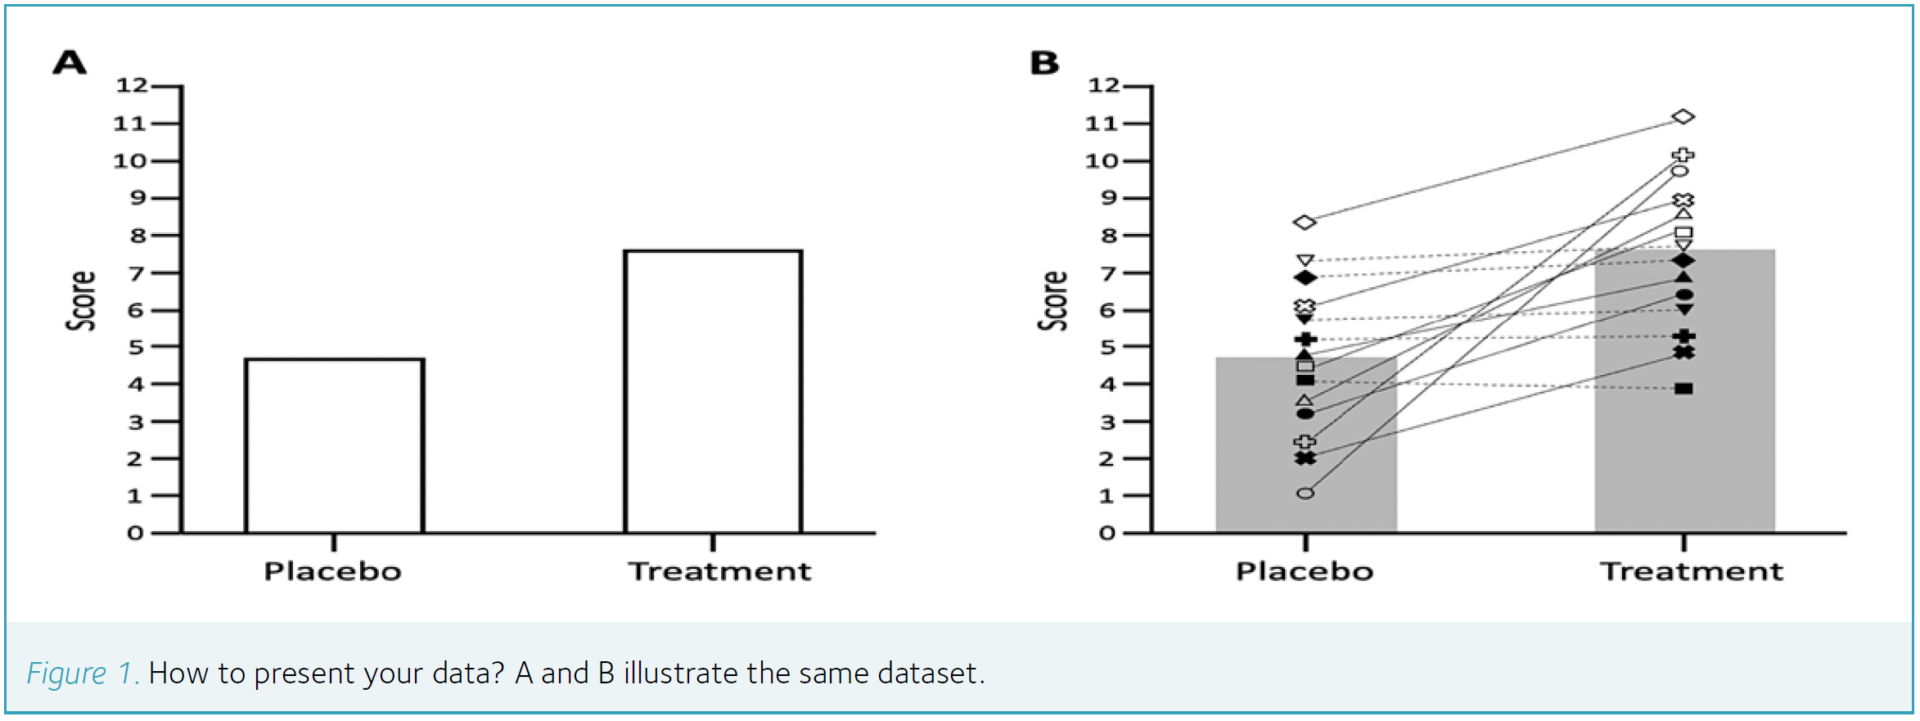
A and B in Fig.1 illustrate the same dataset: Fig.1A reflects the rather uninformative presentation that sadly can be found in many published articles. Not only is this manner of solely presenting a measure of central tendency in each condition an inefficient use of page space (since the same amount of information could be conveyed in text as just two digits) but in physiology research can also reflect a waste of analytical resource (for example, if a researcher was genuinely only interested in the mean blood glucose concentration of a group, then why not just combine the blood of all participants and analyse a single mixed sample?). Of course, in reality, most researchers are interested in variability and at least recognise that individual data are needed for inferential statistical analysis – yet the furthest most papers go in sharing that variability with the reader would be to add error bars to Fig.1A. It is generally a standard deviation used for that error bar, which tells us nothing about the consistency of responses within each individual (only the spread of scores between different individuals) and so the mere inclusion of error bars is not a huge advancement beyond presenting the mean alone (especially when considering the relatively limited sample sizes and often skewed frequency distributions in human physiology research).
On the other hand, one potential advantage of having relatively few individual data points is that this presents an opportunity to fully present all source data in a graphical format. For example, to return to some of the research design issues identified earlier, the unfilled versus filled symbols on Fig.1B could reflect some element of standardisation in pre-test controls – perhaps depending on which individuals did versus did not exercise in the 24 h before each test, respectively (so in Fig.1B that might indicate that prior exercise sensitises participants to the intervention). Similarly, pairing the individual scores between conditions with lines not only illustrates at a glance the consistency of the treatment effect overall but the dashed versus solid lines can also reflect the counterbalanced order of conditions – perhaps depending on which individuals received the placebo versus treatment in their first test, respectively (so in Fig.1B that might indicate that the treatment was only consistently effective when applied in the first test). Notably, with the sample sizes typically found in human physiology research, it is usually possible to allocate each individual participant a dedicated symbol, which can then be used throughout the results section so readers can cross-reference between outcome measures (i.e. to question whether certain individuals consistently rank high or low in the sample).
Using graphical communication as described above can encourage and enable readers to consider the context in which the primary hypothesis was tested but may also generate additional hypotheses that had not previously been considered. In fact, it is difficult to think of any good reason why a full report of individual data would not be recommended – perhaps only in cases where the sheer quantity of data would render the graph indecipherable or, arguably, where the reliability of a measurement tool is only really adequate at a group level (so it might be considered prudent not to encourage a focus on individual responses). Nonetheless, the fact remains that graphical presentation of data is an underappreciated art. Researchers generally accept (albeit often grudgingly) the prospect of spending days or weeks to select and conduct the most appropriate statistical analyses, yet decisions about data visualisation are often made in seconds and barely receive a second thought. It has been argued that “a picture is worth a thousand p-values” (Loftus, 1993) and we contend that appropriate presentation of individual data surely accounts for a good proportion of that number.
References
Byrnes WC et al. (1985). Delayed onset muscle soreness following repeated bouts of downhill running. Journal of Applied Physiology 59(3), 710–715. doi.org/10.1152/jappl.1985.59.3.710
Dwan K et al. (2019). CONSORT 2010 statement: Extension to randomised crossover trials. BMJ 366,l4378. doi.org/10.1136/bmj.l4378 Graham S,
Brookey J (2008). Do patients understand? The Permanente Journal [Online] 12(3). doi.org/10.7812/TPP/07-144
Loftus GR (1993). A picture is worth a thousand p values: On the irrelevance of hypothesis testing in the microcomputer age. Behavior Research Methods, Instruments, & Computers 25(2), 250–256. doi. org/10.3758/BF03204506
Michael RB, Breaux BO (2021). The relationship between political affiliation and beliefs about sources of ‘fake news’. Cognitive Research: Principles and Implications [Online] 6(1).doi.org/10.1186/s41235-021-00278-1
Packer L (1992). Interactions among antioxidants in health and disease: vitamin E and its redox cycle. Proceedings of the Society for Experimental Biology and Medicine 200(2), 271–276. doi.org/10.3181/00379727-200-43433
Pyne DB (1994). Exercise-induced muscle damage and inflammation: a review. Australian Journal of Science and Medicine in Sport 26(3-4), 49–58.
Senn S (2002). Crossover-trials in Clinical Research.2nd ed. Chichester: Wiley.
Acknowledgements
The authors are grateful to Professor Stephen Senn for providing guidance regarding the proper interpretation of carry-over effects within cross-over designs.