
Physiology News Magazine
What can be said for the genetic component of speed and physiological limit?
Are we born to run?
Features
What can be said for the genetic component of speed and physiological limit?
Are we born to run?
Features

Eniola Awodiya
Medical Student at University of Oxford, UK
In physics, speed (or velocity, v) is the time (t) taken to cover a fixed distance (d): v = d/t. The selective breeding of racehorses indicates a genetic component of speed. Research of skeletal muscle fibre types indicates that a speed-favouring predominant fast twitch (type IIa and IIb) muscle fibre type ratio is also, at least in part, genetically determined. To what extent genetic factors can influence speed is unknown, nor is it clear what physiological limits of speed are. Despite incomplete understanding of what a given person (or animal) may be capable of in terms of performance, detection of doping practices in sport is moving toward using artificial intelligence alongside biological data to identify individuals who are outliers and potentially doping. Therefore, improved understanding of performance-associated variables (i.e. genetics and other determinants of limits) could refine methods of doping investigation and prevent mud being thrown that may stick and damage careers.
Evidence for a genetic basis of speed
MSTN gene in horses
Since the mid-1700s, thoroughbred racehorse breeding has involved careful identification of, and selection for, traits predisposing to improved performance over one of five recognised distance categories – an early indication of a genetic basis of speed (Bower et al., 2012). More recently, genome-wide-association studies (GWAS) found a variant of the MSTN gene (C-allele) to be predictive of sprint performance in racehorse populations (Binns et al., 2010). MSTN encodes a transforming-growth-factor β molecule, expressed in skeletal muscle as a negative regulator of muscle mass. However, GWAS intrinsically assume allele frequencies are similar in randomly mated groups and racehorses – including those randomly selected in experimental protocols – are highly related. Indeed, some 95% of all thoroughbred racehorses are sired by common ancestor Darley Arabian.
Selection pressures for this gene may also be compatible with a genetic basis of speed (Bower et al., 2012). To find potential sources for this C-allele, one study sampled standard-bred horses in regions mapping those selected for in thoroughbred founder lines. It had a frequency ranging between 0 and 0.5 in Eurasian populations and up to 0.90 in the infamous sprinter, the Quarterhorse. Given that the Quarterhorse has undergone intense selection for speed from the mid-1800s (~100 years after the thoroughbred), its high frequency of the C-allele indicates that population-specific selection pressures are significant. These findings begin to point towards a genetic basis of speed; however, no causal relationship can be assumed.
ACTN3 protein in humans
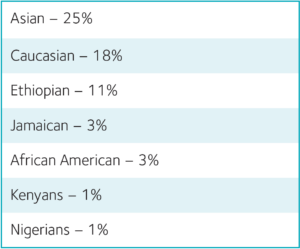
Alpha-actinins are found at Z-discs and cross-link actin filaments of adjacent sarcomeres (Chan et al., 2008). α-actinin-3 (ACTN3) is exclusively expressed in fast glycolytic muscle fibres. Homozygosity for a common polymorphism results in total deficiency of the ACNT3 gene (XX). This XX genotype – present in ~1 billion individuals worldwide – has a detrimental effect on speed and power performance, favouring endurance (Yang et al., 2003). A lower incidence of ACTN3-deficiency in Australian sprint and power athletes compared to the general population (Fig.1) has been identified and the finding reproduced in Elite Finnish athletes (Yang et al., 2003; Niemi and Majamaa, 2005). Ethnicity appears relevant here, with different frequencies of the XX genotype observed in different ethnicity strata (Table 1) (Yang et al., 2003). These findings from large linkage and observational datasets indicate yet another genetic component of speed in ACTN3 (but aforementioned limitations are applicable here).

A proposed molecular mechanism for these findings may strengthen the argument for a genetic basis of speed. The mechanism involves ACNT3 and calcineurin, known to induce the type 1, oxidative, slow-twitch phenotype in skeletal muscle remodelling (Delling et al., 2000). After 4 weeks of endurance training, ACNT3-KO mice (analogous to human ACTN3XX) presented with greater endurance and faster recovery from fatigue alongside concurrent increases in calcineurin compared to WT mice (Seto et al., 2013). Competitive binding of ACTN2 for regulatory molecule calsarcin-2 leads to increased release of calcineurin from baseline calsarcin-2 inhibition in the absence of ACTN3. However, this is not observed in humans. No difference in V.O2peak was observed between human ACTN3XX and ACTN3RR genotypes following a 4 week endurance training protocol (Papadimitriou et al., 2019). Of course, murine muscle has a much higher percentage of fast-twitch fibres compared with human muscle, potentially creating an over-represented effect of pathway-induced fibre-type switching. Additionally, there is a lack of diversity in the human study to indicate that the findings are externally valid.
Olympic trends do not support genetics being the most important determinant of speed
Despite selective breeding and genetic-based studies indicating a possible genetic basis of speed, data on Olympic 100 m performances throughout history suggests genetics are a non-essential factor for speed. Since the advent of Olympic races, there has been a steep downward trend in times recorded; that is to say, sprinters are getting faster (Fig.2). In contrast to thoroughbred racehorses, human speed has increased in one third of the time, with no selection and mating bias imposed. In a purely genetic model of speed, a constant plateau or much shallower gradient of change in speed at this stage of evolution should be revealed – of course, few, if any, would argue that training and nutrition practices do not come into play. This is not to say that genetic predisposition to larger gains from training or direct genetic contributions to speed do not provide an edge at the elite level. Clearly, to what extent genetics is a factor in speed requires more research to be determined.

Physiological limits of speed
Data trends allow an estimate for which year the infamous 9- and 10-second barrier for men’s and women’s races respectively, may break if improvements continue at this rate:
- Men’s 9-second barrier: 2068
- Women’s 10-second barrier: 2055
One important question is: what causes these barriers?
The force-velocity (F–V) relationship
Initially, determining force–velocity relationships involved timed (t) elbow flexion to spin various weights (F) at fixed ranges of motion (d) to infer the relationship was an inverse-linear one (Huxley, 1957). Refined protocols addressed needs for muscle isolation due to potential effects of antagonistic muscle groups and a new inverse-hyperbolic F–V relationship was inferred. Interestingly, amputee volunteers – as an example of in vivo isolated pectoralis muscle activity – presented similarly (Huxley, 1957).
This maps well onto sliding-filament theory (SFT) and provides a molecular explanation for limits in speed (Huxley, 1957). In SFT, the total tension in muscle is the sum of tension generated by all contraction sites within half of the sarcomere. Hence, an inverse F-V relationship can be observed because of an increase in non-bound actin and myosin filament pairs to form sufficient cross-bridges or because of an increased proportion of cross-bridges formed that cannot readily dissociate for the next cycle, thereby generating an opposing force.
The spring-stance model of running gait

The heralded spring-stance model of optimal running gait (Fig.3) involves (i) the stance phase where weight compresses limbs to store strain-energy in elastic tissues, before release via elastic recoil to accelerate the body, followed by (ii) the swing phase in which the opposite limb is repositioned to repeat the cycle on impact. The model has been tested in both high and low-velocity running, using a high-speed treadmill and n = 7 sprinters and non-sprinters (Weyand et al., 2010). While both groups spend equal time repositioning limbs in swing phases of maximal-speed running – suggesting a passive mechanism of energy transfer model – differences were observed between stance phases. Fig.4 highlights this: the spring-stance model shows a symmetrical half-sine waveform on a vertical ground reaction force–time graph, depicting stored energy released in the reverse vector over time. While lower speeds and non-elite athletes mimicked this, sprinters at top speeds showed a consistent asymmetric waveform. This suggests faster athletes converged on a common mechanical solution for speed.
The elite sprinter applies a greater stance-averaged peak vertical force in a swifter contact phase than is typical for both the non-sprinter and the spring-stance model (Fig.5). Elite sprinters, rather than using recoil and passive propulsion, apply greater force in minimal contact times, aided by actively lifting the knee. Torque capabilities of knee and hip extensors and flexors also support this. Synchronised electromyography (EMG) activity indicates maximal hamstring activation just before ground contact and high eccentric hamstring peak torque ability as is necessary for maximal horizontal-force production. Further work supports this (Clark and Weyand, 2014).
One study used exaggerated models for speed parameters of ground reaction force (GRF), ground contact time (GCT) and horizontal force production (involving one-legged hopping, forward running, and backward running) (Weyand et al., 2010). Although force applied in one-legged hopping was on average 30% greater than in forward running, velocity was reduced in comparison – highlighting the importance of aerial time in speed. Furthermore, force applied to the treadmill by extensor muscles in hopping gaits was on average 82% higher than that applied by identical muscle groups in sprinting gaits. The time course of a single electrical impulse to a human knee or ankle extensor is between 81 and 120 ms in young adult men (Weyand et al., 2010). This is twice the time available in top speed running for GCF to be maximised.
It appears that within human physiology, limits to speed lie in the trade-off made in generating GRF maximums within GCT minimums. However, much of this evidence arose from treadmill analysis of running gait where both sagittal foot-strike angle and knee flexion range are not strictly representative of overground running (Weyand et al., 2010). Future work could benefit from overground running study replications.
In animal physiology, galloping behaviour as enabled by pronounced backbone bending increases foot-ground contact times and lengths, thereby enabling a higher force production and application with no trade-off limitations in time wasted on the ground. Interestingly, this may suggest how the current fastest man in the world – Usain Bolt – claimed his title: his height allows a stride length of 2.77 m compared to averages of 1.52 m. According to this model, Bolt would have to make approximately 30 fewer strides than average within 100 m, and so 30 fewer ground force-ground contact time trade-offs, identified here as the limits of speed. This too may further suggest genetic contributions to speed with height phenotypes.

Implications
The World Anti-Doping Agency (WADA) monitors doping practices and refines detection techniques to overcome these. Genetics participate in speed, and alongside rising CRISPR-Cas9 technology, there have been attempts to utilise gene editing tools as means for gaining a competitive edge in horseracing. Further research into associated genes to generate screening profiles for known loci of interest may be beneficial in combatting this.
Similarly, there is potential to improve technological doping. Controversy surrounds Nike Vaporfly running trainers and Nike Air Zoom Maxfly sprint spikes – a form of “super spike” using foam padding just above spike plates. Given the importance of gait, foot strike and GCF in limiting speed, a shoe design overcoming this to maximise force output for the same fixed time is an obvious advantage. Potential for technologies to unfairly influence sport was recognised: the former of these trainers has since been banned by World Athletics in January 2020. However, it remains an open and exploitable factor worth highlighting, given what is now known.
An approach under development by WADA is an athlete-specific biological passport to track performance and known performance-associated variables, to create a personalised model from which outliers are clear. An interesting avenue for future research would be a computerised model of optimised human sprinting gait based on data findings, to predict limits of male and female speed more accurately. Although not absolute, it could supply a framework through which obvious outliers are highlighted for further investigation. Streamlining this (within rigorous ethical guidelines) to find predictive physical characteristics such as extensor muscle and limb lengths combined with known power measures such as the standing long jump, both of which inform sprint gait maximums, could aid closer athlete-specific observation.

Conclusions
Evidence has shown that there is a genetic basis of speed, with multiple GWAS suggesting their association. There is some evidence to suggest that this may be via influences on phenotypes associated with speed such as muscle fibre type. However, these data are is too limited to conclude that genetics is the sole or even most important determinant and trends in Olympic data further highlight this. Further work researching technological and performance kit advances of the last century could begin to quantify their input. Concerning limitations of speed, treadmill analysis of gait recommends a departure from the popular existing model, suggesting an alternative asymmetrical force application–time relationship selected for at higher velocities.
A collection of observing large cohorts of fast runners, comparing human physiology to fast animal counterparts, and investigating a molecular explanation cumulatively show that speed limits arise when GCF is limited as a factor of GCT. Moving forward, this posits exciting opportunities for personalised computer models to both track athlete potentials and profiles as an anti-doping strategy. Further work would need to expand gait findings to whole-body systems, and scale-up genome studies for this.
References
Binns MM et al. (2010). Identification of the myostatin locus (MSTN) as having a major effect on optimum racing distance in the thoroughbred horse in the USA. Animal Genetics 41 (2), 154-8. https://doi.org/10.1111/j.1365-2052.2010.02126.x
Bower MA et al. (2012). The genetic origin and history of speed in the Thoroughbred racehorse. Nature Communications 3, 643. https://doi.org/10.1038/ncomms1644
Chan S et al. (2008). A gene for speed: contractile properties of isolated whole EDL muscle from an-actinin-3 knockout mouse. American Journal of Physiology – Cell Physiology 295, 897–904 https://doi.org/10.1152/ajpcell.00179.2008
Clark KP, Weyand PG (2014). Are running speeds maximized with simple-spring stance mechanics? Journal of Applied Physiology 117 (6), 604-15. https://doi.org/10.1152/japplphysiol.00174.2014.
Delling U et al. (2000). A calcineurin-nfatc3-dependent pathway regulates skeletal muscle differentiation and slow myosin heavy-chain expression. Molecular and Cellular Biology 20. https://doi.org/10.1128/MCB.20.17.6600-6611.2000
Huxley AF (1957). Muscle structure and theories of contraction. Progress in Biophysics and Biophysical Chemistry 7, 255–318.
Niemi AK, Majamaa K (2005). Mitochondrial DNA and ACTN3 genotypes in Finnish elite endurance and sprint athletes. European Journal of Human Genetics 13, 965–969. https://doi.org/10.1038/sj.ejhg.5201438
Papadimitriou ID et al. (2019). A “human knockout” model to investigate the influence of the α-actinin-3 protein on exercise-induced mitochondrial adaptations. Scientific Reports 9, 12688. https://doi.org/10.1038/s41598-019-49042-y
Seto JT et al. (2013). ACTN3 genotype influences muscle performance through the regulation of calcineurin signaling. Journal of Clinical Investigation 123, (10):4255-63. https://doi.org/10.1172/JCI67691
Weyand PG et al. (2010). The biological limits to running speed are imposed from the ground up. Journal of Applied Physiology 108, (4), 950-961. https://doi.org/10.1152/japplphysiol.00947.2009
Yang N et al. (2003). ACTN3 Genotype Is Associated with Human Elite Athletic Performance. The American Journal of Human Genetics 73 (3), 627-31. https://doi.org/10.1086/377590References