
By Tashi Raina, Liz Blanks and Alireza Mani from University College London (UCL), UK
The Historic Objects and Collections at UCL series presents Physiological Instrument #045, a kymograph permanently on display in the A.V. Hill Lecture Theatre on UCL’s main campus in Bloomsbury, London. In this series, the team shares the stories of physiological artefacts housed within the Institute’s rich collection. The second object featured is an early-twentieth-century kymograph, a device used for recording physiological signals.
Recording and reporting physiological signals
When examining a physiological trace graph printed in a research paper, the format is well recognised: a white background with black lines denoting the physiological signals. Graphs with this layout are seen across all physiological fields, whether it be an electrocardiogram, a spirogram in respiratory physiology, or an electroencephalogram. However, if one were to consult a physiological signal printed in a paper or textbook from the 1850s to the 1930s, there would be a significant difference.
Graphs produced from this time period had the characteristic of a black background, with white lines displaying changes. Figure 1 presents examples of such traces from seminal historical reports, including the first human electrocardiogram by Einthoven (Figure 2A), the discovery of acetylcholine as the vagus substance by Loewi (Figure 2B), the discovery of secretin by Bayliss and Starling (Figure 2C), and the discovery of prostaglandins by von Euler (Figure 2D).
Now, whether printing a book in today’s time or in the 1900’s, using a black background requires a tremendous quantity of ink – as well as the extortionate cost of printing. This posed the question: if printing a graph with a black background was expensive and inefficient – why was it being done?
The invention responsible for the blackened graphs represents one of the greatest contributions to physiological science and was developed during the discipline’s transition from speculative inquiry to scientific rigour. Carl Ludwig’s creation of the kymograph revolutionised the way physiologists studied human physiological processes, laying the foundation for many subsequent discoveries and innovations.
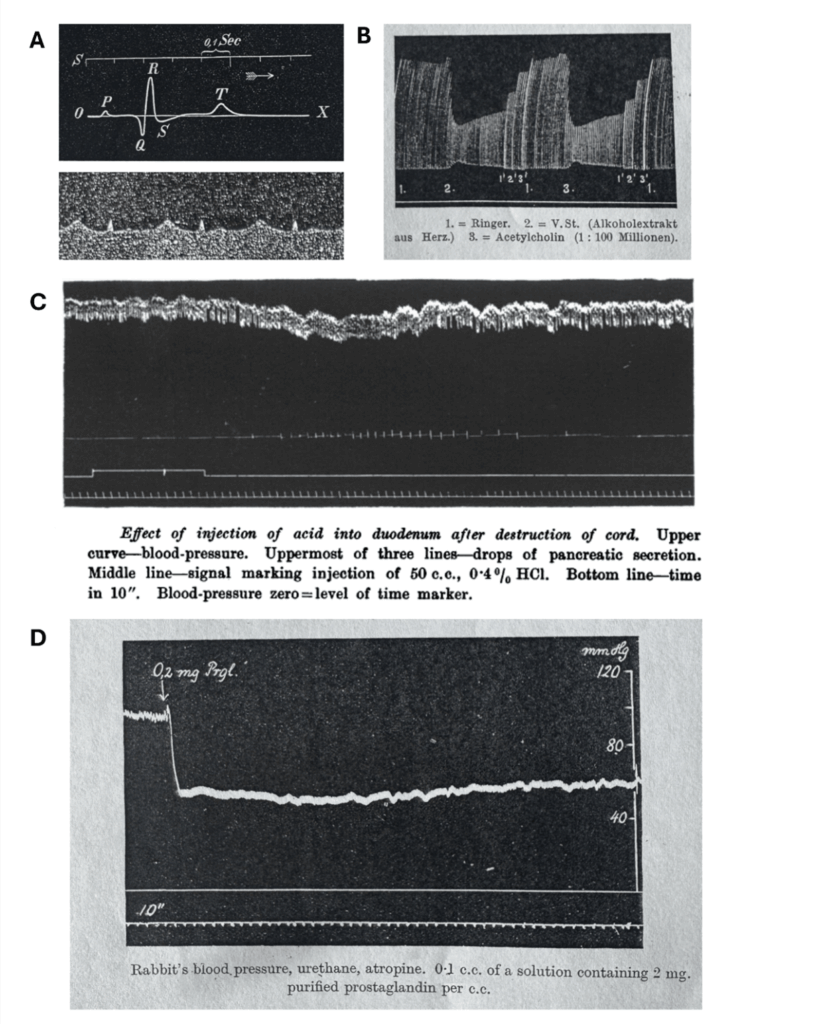
Figure 1. Figures from seminal reports showing original physiological signals recording by the use of a kymograph. A. The first human electrocardiogram by Einthoven in 1895 (1), B. the discovery of acetylcholine as the vagus substance (Vagusstoff or V.St. in this figure) by Loewi in 1926 (2). C. the discovery of secretin by Bayliss and Starling in 1902 (3), D. the discovery of prostaglandins by von Euler in 1936 (4).
Permanent and accurate physiological data
The kymograph (e.g., Figure 2) consists of a rotating brass drum covered with smoked paper, which provides a recording surface on which a stylus traces movements produced by muscles, pressure transducers, respiratory mechanisms or other physiological processes. By etching the smoked surface, these movements are permanently recorded as light lines against a dark background.
The word Kymograph is Greek; consisting of “Kyma” – meaning to wave, and “Graphō” – meaning to write. The kymograph was a device that displayed waves and oscillations and was invented by Carl Ludwig in 1847 to solve a fundamental problem faced by physiologists at the time. Whilst they were able to observe changes in physiological phenomena such as blood pressure oscillations, heartbeats, muscle contraction or respiration, they were unable to record those changes over time.
Quantitative collation of data was unheard of, accuracy was impossible; the fluctuating nature of biological processes made it arduous to study. There was no method of producing a permanent and accurate record of physiological data; as a result, research at the time was based mostly upon assumption, due to not having any data to draw logical conclusions from. The need to transform transient biological events into quantitative, tangible, graphical data – gave birth to the invention of the kymograph.
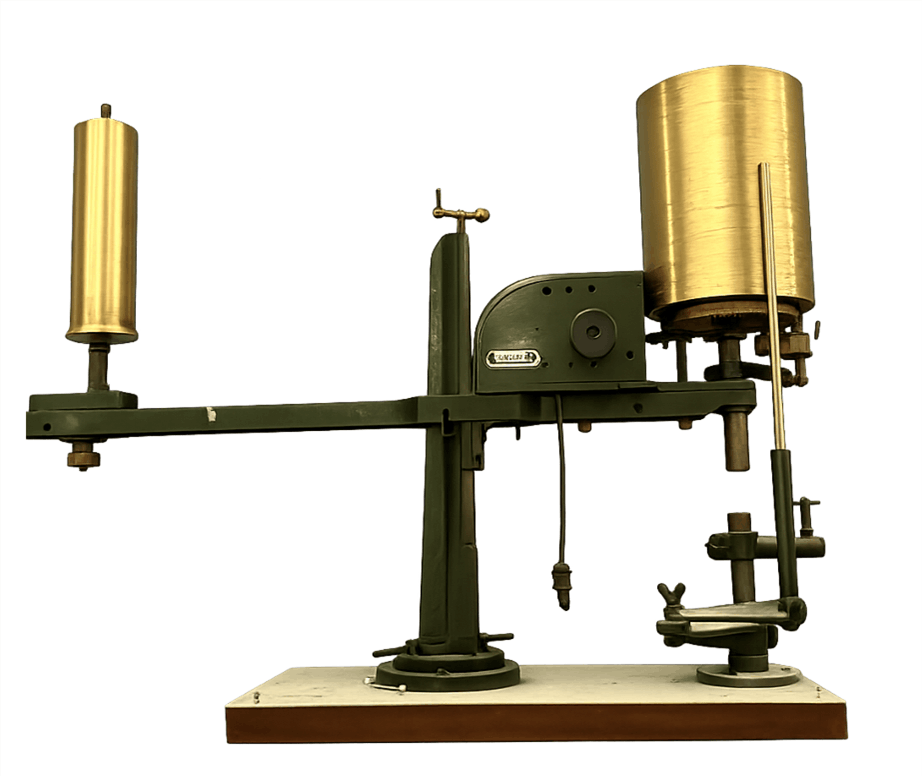
Figure 2. A kymograph on display in the A.V. Hill Lecture Theatre at University College London. This instrument was used to record physiological processes as continuous traces over time. A rotating brass drum, covered with smoked paper during recording, provided a surface on which a stylus traced movements generated by muscles, pressure transducers, respiratory mechanisms, or other physiological processes. This type of kymograph was manufactured in Britain by C.F. Palmer Ltd (London), and was a standard research and teaching apparatus in physiology laboratories from the late nineteenth century through the interwar period. Its precision clockwork motor and centrifugal governor enabled stable, repeatable recording speeds, essential for quantitative experimental analysis.
Carl Ludwig and the invention of the Kymograph
Carl Ludwig (1816-1895) was a German physiologist and professor at the University of Leipzig. He was directly mentored by Johannes Müller (1801-1858), whose approach to physiology profoundly shaped the early development of experimental physiology. Müller’s mentorship steered Ludwig away from the speculative methods of discovery prevalent at the time and toward a more rigorous, causal, and analytical approach to physiological research.
The importance of empirical methodology was ingrained into Ludwig and served as the inspiration for the invention of the kymograph. Ludwig is recognised to have made significant contributions to all branches of physiology with his invention of the kymograph and the mercurial blood pump. Ludwig conceptualised the kymograph while attempting to improve measurement of blood pressure in arterial vessels, in order to understand the correlation between the respiratory and cardiovascular system in 1847 (5). Existing instruments of the time such as Poiseuille’s manometer were unable to provide long term recordings of data, and Ludwig endeavoured to create a tool that would allow for continuous data logging, simultaneous recording of variables and accuracy.
Creating a visual record of blood pressure changes
Recording using a kymograph involved three components: the physiological input system, the transduction system and the system of recording the data (Figure 3). For example, to study the changes in blood pressure of an individual, a cannula would be inserted into a blood vessel – usually an artery – the cannula would be filled with saline connected to the rubber tubing of the manometer.
The manometer is a U-shaped glass tube, partially filled with mercury, with one end connected to the cannula and the arterial system, and the other end open to the atmosphere. As the blood pressure rose or fell, the mercury in the manometer would rise and fall due to the changes in pressure. A mechanical lever would sit above the mercury level in the manometer; and would magnify the up-down changes in the mercury level.
The free end of the lever held a needle or a stylus, which would etch the pressure changes onto a sooty rotating drum, producing a graphical render of the blood pressure changes. The drum was covered with smoked paper, and the light scratches made by the stylus displaced the soot to create a visual record of pressure changes that was tangible and permanent for interpretation and analysis. The drum rotated at a set speed, ensuring a constant time interval, which was often recorded on the kymograph with a separate stylus (for example, beneath the recordings shown in Figures 1C and 1D). The lever amplified minute pressure changes, allowing clarity in the graph, while reproducibility and objectivity were ensured.
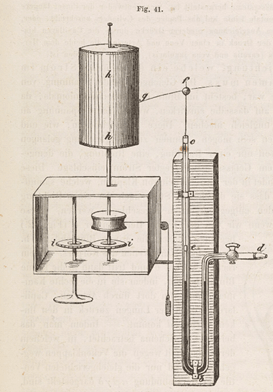
Figure 3. A schematic illustration of the kymograph structure used to record blood pressure. The figure is taken from Ludwig’s Textbook of Physiology, published in 1856 (6).
Transitioning from smoked-paper etchings
The first kymograph was constructed for recording blood pressure changes; however its application proved essential to many other physiological niches such as cardiac electrical cycles, respiration, muscle contractions and nerve impulses. The application of the kymograph to other areas of physiology required adjustments and modifications to its components. Because nerve impulses involve electrical signals, transducers were developed to convert physiological events into mechanical movements, which could then be plotted by a physiological recorder such as the classical kymograph.
The transition from the smoked-paper kymograph to ink-writing physiographs was a gradual technological evolution from the late nineteenth century into the early twentieth century driven by the need for cleaner, more durable, and more easily reproducible records of physiological signals. Today’s physiological discoveries are illustrated on white background and are digitally constructed with the use of machinery of the modern era. Although the kymograph is now redundant in comparison to machines with a greater capacity for accuracy, they all owe their thanks to the foundation built by Ludwig’s kymograph; one that established scientific rigour and precision.
If you missed the first artefact on display by the UCL Historic Objects and Collections team, read their blog Bárány’s Box to discover more about the inventor and his mechanical noise instrument.
References
- Einthoven W. Über die Form des menschlichen Electrocardiogramms. Archiv für die gesamte Physiologie des Menschen und der Thiere, 1895; 60(3), 101–123.
- Loewi O, Navratil E. Über humorale Übertragbarkeit der Herznervenwirkung. X. Mitteilung. Über das Schicksal des Vagusstoffes. Pflügers Arch Ges Physiol 1926; 214: 678–688.
- Bayliss WM, Starling EH. The mechanism of pancreatic secretion. J Physiol, 1902;28(5), 325–353.
- von Euler US. On the specific vaso-dilating and plain muscle stimulating substances from accessory genital glands in man and certain animals (prostaglandin and vesiglandin). J Physiol, 1936; 88(2), 213–234. https://doi.org/10.1113/jphysiol.1936.sp003433
- Ludwig C. Beiträge zur Kenntnis des Einflusses der Respirationsbewegungen auf den Blutlauf im Aortensysteme. Archiv für Anatomie, Physiologie und wissenschaftliche Medicin (Müller’s Archiv). 1847:242–302.
- Ludwig C. Lehrbuch der Physiologie des Menschen. Vol. 2. Heidelberg & Leipzig: C.F. Winter; 1856. p. 85, fig. 41. Image credit: Wellcome Collection, London.
Acknowledgment: The authors are grateful for the inspiration provided by Professor Ahmad R. Dehpour.