Acute intermittent hypoxia (AIH) elicits long-lasting increases in ventilation (VI) that persists for hours after the inducing stimulus. This form of respiratory motor plasticity is termed ventilatory long-term facilitation (LTF). In awake humans, AIH-induced ventilatory LTF is critically dependent upon CO2. For example, poikilocapnic AIH results in slight hypocapnia, which masks LTF due to negative chemofeedback inhibition of VI. However, when AIH is superimposed upon a background of mild hypercapnia whereby end-tidal CO2 pressure (PETCO2) is clamped before, during and after AIH, increases in VI of up to 50% are observed. One caveat of all ventilatory LTF experiments conducted to date, is the absence of considering changes in CO2 production rate (VCO2) that could influence changes in VI in accordance with the alveolar ventilation equation. Thus, the purpose of the current study was to test the hypothesis that the magnitude of ventilatory LTF induced by hypercapnic AIH is altered by adjusting changes in VI to changes in PETCO2 and VCO2. Here, we report preliminary results from eight healthy males (age=22±3 years). Subjects attended two laboratory visits on separate days. On day 1, pulmonary function testing was performed; on day 2, subjects were exposed to hypercapnic AIH. Subjects sat quietly on a chair with their back supported and facemask on. The mask was connected to a pneumotachograph and three-way stopcock on the inspired side and mixing chamber on the expired side. One limb of the stopcock sampled ambient room air and the other sampled gas from two 200-L Douglas bags filled with ~8% O2. Inspired and expired gases were obtained from calibrated O2/CO2 gas analysers. After ~10 min of resting eupnoea, 100% CO2 was titrated into the inspired circuit to raise PETCO2 by ~3 mmHg (baseline, B). Fifteen, 1-min episodes of hypoxia were administered, interspersed with 90-s intervals breathing ambient air. Mild hypercapnia was maintained throughout AIH and for 20 min after (recovery, R). Ventilatory LTF was quantified by two methods: (Method 1) traditionally as VI,R/VI,B·100, and (Method 2) via an equation (Equation 1) that accounts for changes in PETCO2 and VCO2. Equation 1 can be simplified to quantify ventilatory gain (Gv) at baseline and in recovery, shown in Equation 2. When calculated as a %-change, Equation 2 equals Equation 1.
Equation 1: ((VI,R/VI,B)·(PETCO2,B/PETCO2,R))/((VCO2,R/VCO2,B)·(VI,B/VI,R))·100
Equation 2: Gv=(VI/VCO2)·(VI/PETCO2)
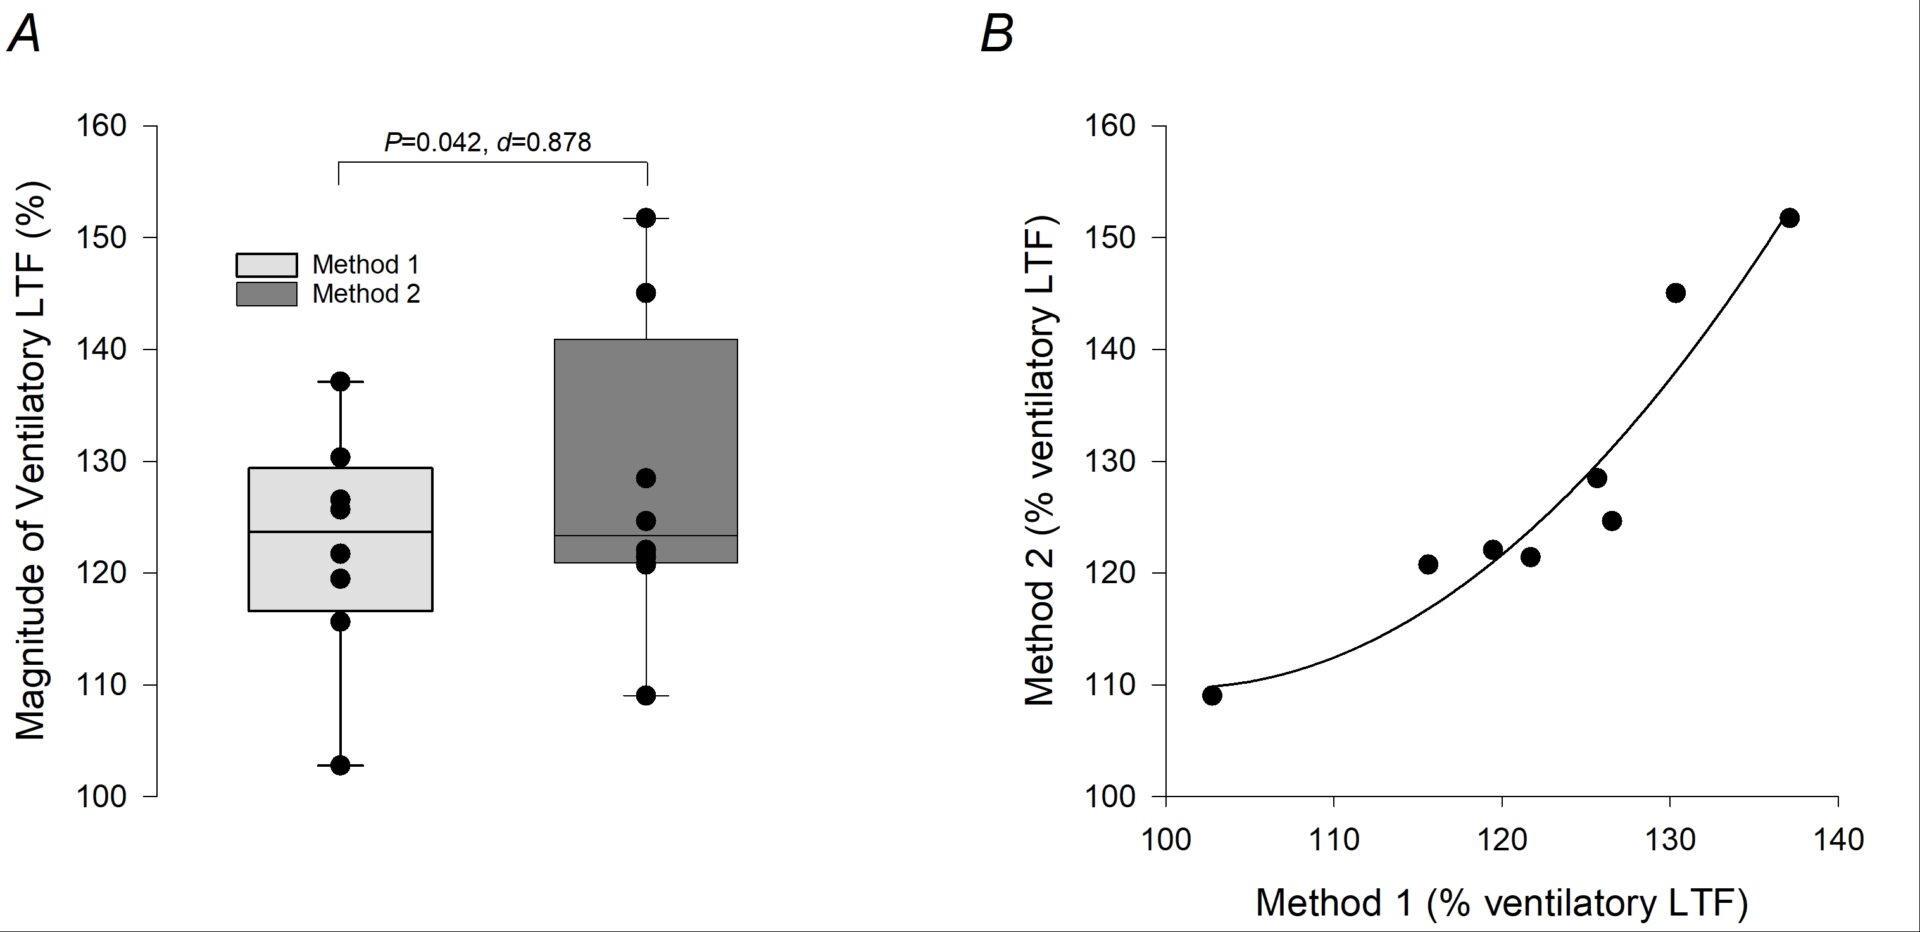
Peripheral arterial oxyhaemoglobin saturation and end-tidal O2 pressure decreased to 82±1% and 49±2 mmHg during hypoxia, respectively. During recovery versus baseline, VI increased by 3.1±1.6 L/min, VCO2 increased by 81±52 mL/min and PETCO2 was unchanged (+0.15±0.89 mmHg). When normalised to VI, VCO2 decreased by 1.8±1.7 mL/L/min (Table 1). On average, the magnitude of ventilatory LTF calculated by Method 1 was +22±10% (P<0.001) and calculated by Method 2 was +28±14% (P<0.001). A significant difference between Methods 1 and 2 was found (P=0.042, d=0.878, Figure 1). A quadratic model predicted the relationship between Methods 1 and 2 (R2=0.913, Figure 1). Thus, based on our preliminary findings, accounting for small changes in PETCO2 and CO2 significantly alters the quantified magnitude of ventilatory LTF after hypercapnic AIH.