Introduction
Oxygen Extraction Fraction (OEF) and venous Cerebral Blood Volume (vCBV) provide crucial insight into brain oxygen metabolism, but their co-linearity in the qBOLD model leads to unstable estimations. We address this by integrating a flow-diffusion model of oxygen transport into the qBOLD framework (1), which introduces physiological priors derived from quantitative perfusion maps (2) (via ASL (5)). This approach stabilizes the OEF and vCBV estimations while requiring only ASL as additional input (3,4). Building on the recent successful application of a highly sensitive GE-SE EPIK sequence (Kuppers et al. (6)) for rapid vCBV estimation, we integrated our flow-diffusion model to stabilize the direct vCBV estimations derived from the qBOLD equations applied to the GE-SE EPIK signal.
Methods
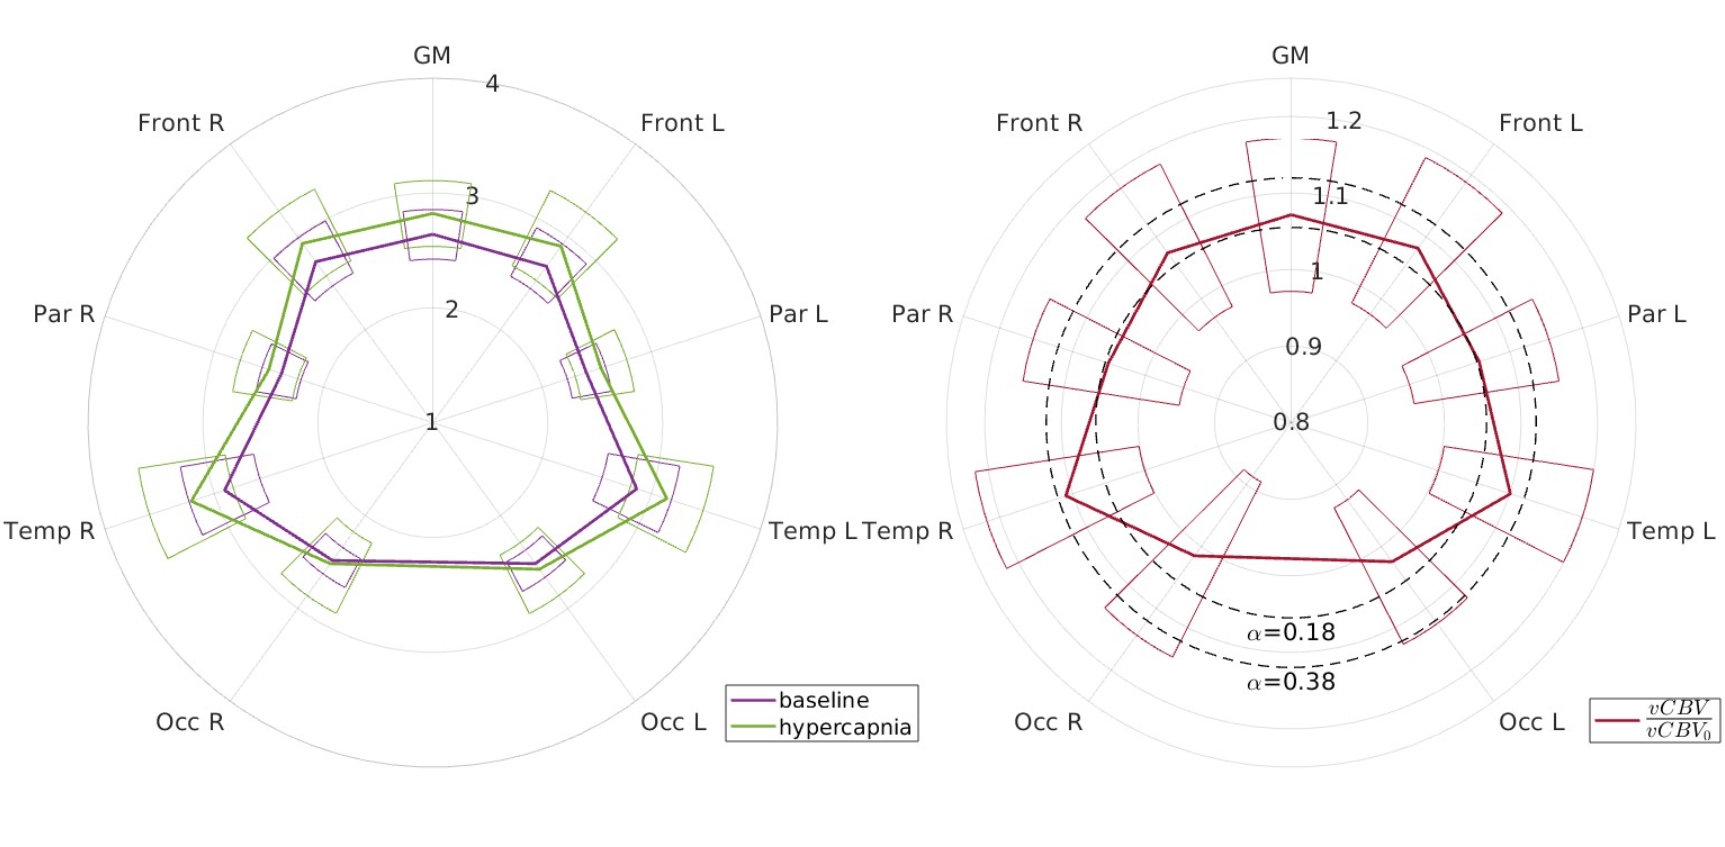
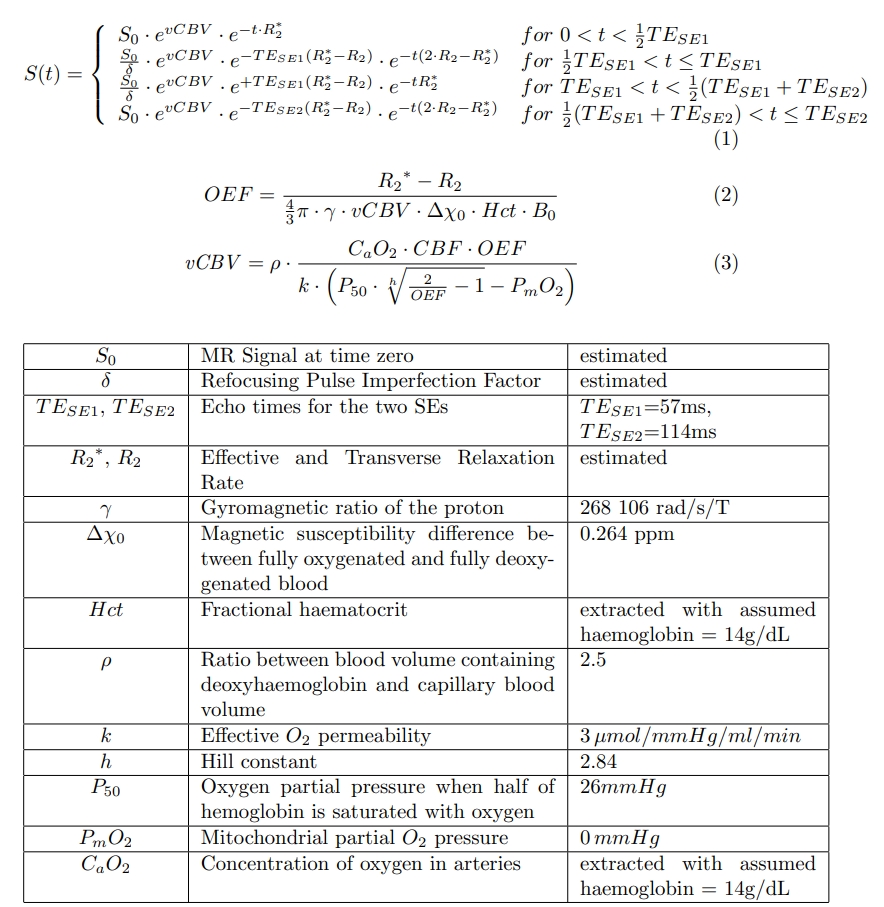
All data were acquired using two 3T Siemens Prisma scanners with 32-channel head coils. 21 healthy participants (mean age 31.9+-6.5 years) took part in the study. Scanning session included structural MPRAGE (1mm iso), the rapid GE-SE EPIK sequence (10 echoes, 1.9×1.9×3.3mm3, acquisition time <2 min (6)), and perfusion imaging via Velocity-Selective Arterial Spin Labeling (VS-ASL, 3.3×3.3×6.0mm3, acquisition time <5 min (5)). The GE-SE EPIK and VS-ASL measurements were conducted during two separate 10-minute isometabolic hypercapnic gas challenges (5% CO2). This allowed the quantitative measurement of vCBV increase consistent with the Grubb relationship (9) (CBF/CBF0)alpha, where CBF0 is perfusion in baseline, with an exponential alpha of 0.38 in animal model or 0.18 in healthy subjects (10). Non-linear least-squares fitting of the qBOLD model (Equations 1 and 2 in Figure 3) gave vCBV and OEF maps (Equation 3).
Results & Discussion
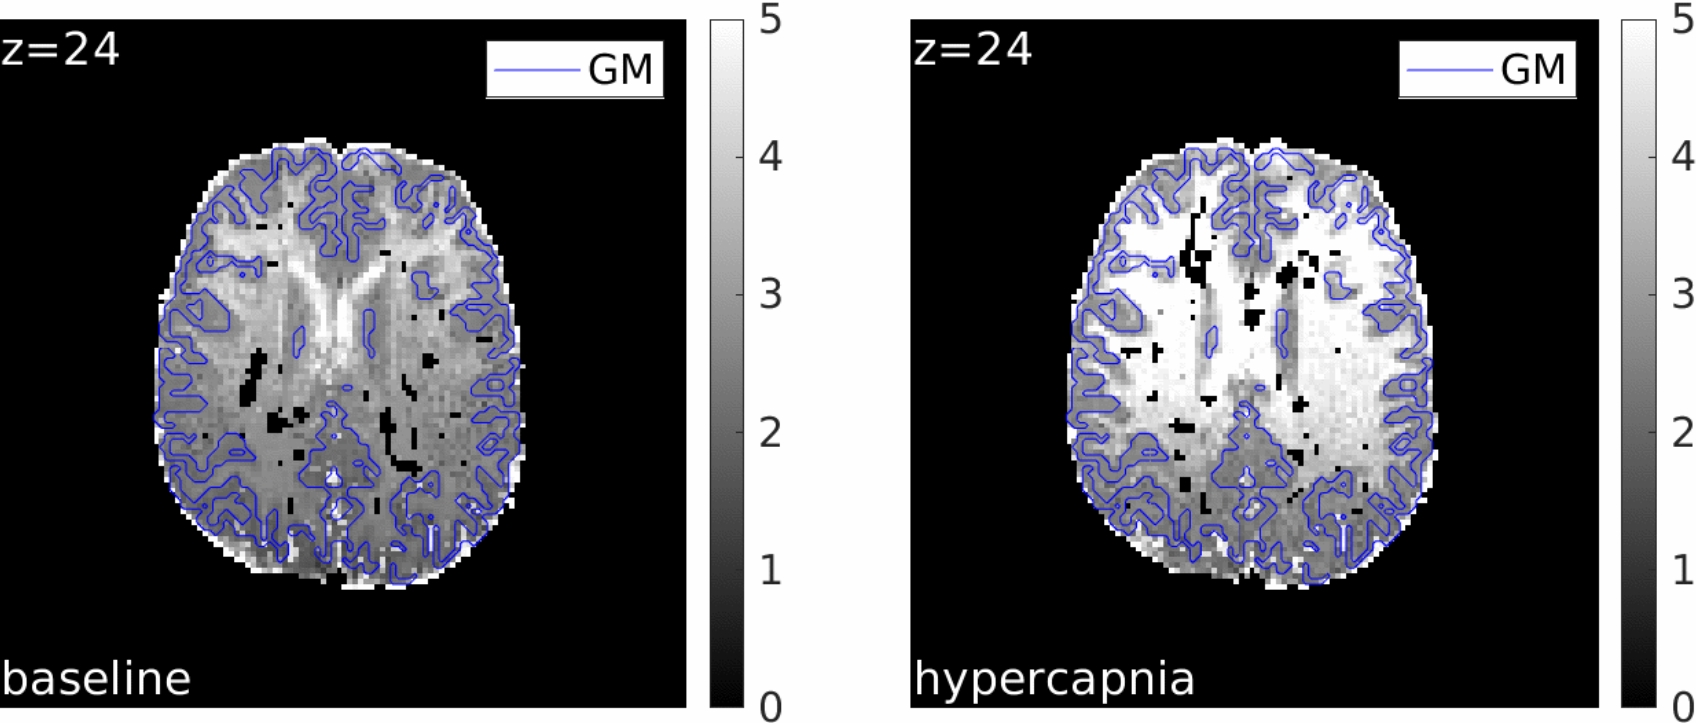
Figure 2 displays the vCBV maps for a representative healthy participant at baseline (left) and during hypercapnia (right). The vCBV values exhibit good contrast across the grey matter (GM) area. However, vCBV estimations in white matter (WM) show a slight bias against the expected reduced values relative to GM, likely due to non-blood sources of susceptibility. Inhomogeneities are also noticeable within the WM when transitioning between anterior and posterior regions. The average vCBV (in [%]) for the healthy cohort is summarized in Figure 3: reported ROIs are left and right frontal (Front), parietal (Par), temporal (Temp) and occipital (Occ). Baseline vCBV was measured at 2.64+-0.22% (mean +- standard deviation over normal-appearing GM), consistent with literature. A significant increase in vCBV to 2.82+-0.29% was observed during the hypercapnic modulation (left side of Figure 3) as a result of the induced hyperemia (CBF increased by 34.68+-13.92% from a baseline of 55.50+-12.54 ml/100g/min). This vCBV increase aligns closely with the Grubb relationship, as shown on the right side of Figure 3: our study result (1.0716+-0.999) is near the expected increase with alpha=0.18 (1.0543+-0.0190 (10)).
Conclusion
The flow-diffusion model successfully regularised the estimation of vCBV directly from fast GE-SE MR signal measurements, requiring only additional ASL-based perfusion maps. GM values for vCBV were consistent with established literature, demonstrating sensitivity to both altered physiological conditions and pathology. With further refinement, this method offers the potential for rapid, accurate, and non-invasive measurement of tissue oxygenation, enabling clear clinical translation.