Introduction
The heart exhibits organized excitations and contractions as a physiological syncytium comprised of numerous cardiomyocytes. However, the extent to which myocyte structural arrangement varies across cardiac phases remains unknown.
Aims and objectives
We aimed to visualize the spatiotemporal variance of sarcomere length (SL) in the subepicardial myocardium of the beating heart at a histological scale. To capture snapshots of the SL distribution across the myocardium during systole and diastole, we performed rapid cryofixation with phase-targeting in isolated rat hearts [Ref.].
Method
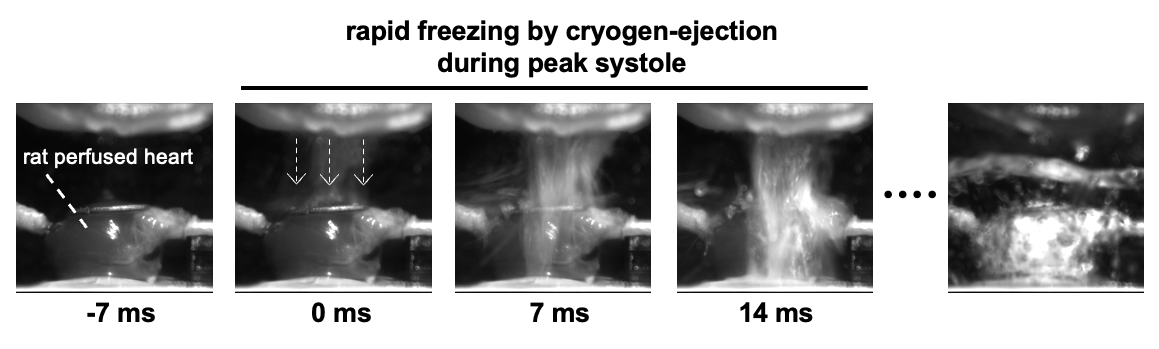
Using a home-built cryogen-ejection system, the Langendorff-perfused rat heart was rapidly frozen during peak systole or end diastole under electrical pacing at 0.5 Hz. Figure 1 shows sequential side-view photographs of the heart in the rapid freezing during peak systole. The frozen heart, subsequently fixed with paraformaldehyde (PFA) and acetone by a freeze-substitution procedure, was immuno-stained to visualize α-actinin of sarcomere structures (i.e., Z-line). Fluorescence image of the Z-line in myocytes of the subepicardial myocardium (>44,000 µm2/image) was obtained via confocal laser-scanning microscopy. The representative value of SL for each myocyte was calculated from the Fourier transform of the line profiles of the Z-line cycle. To visualize the local SL distribution in myocytes, heatmaps were reproduced from the fluorescence images of Z-lines. All animal experiments were approved by the Animal Research Committee of Kyoto Prefectural University of Medicine. Hearts were excised (i.e., euthanasia) from Wistar rats (male, 9-13 weeks old) under deep general anesthesia.
Results
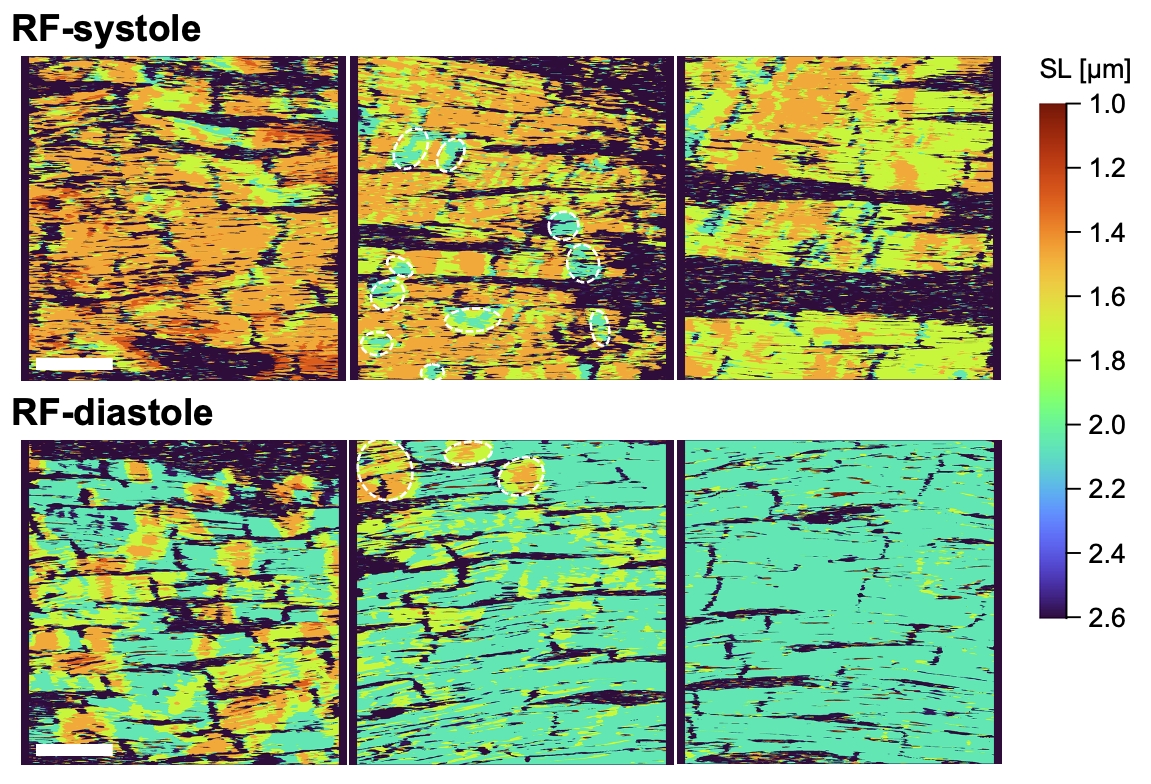
In the fluorescence images of hearts prepared via phase-targeting rapid cryofixation, the Z-lines in myocytes appeared closely spaced in the hearts rapidly frozen during peak systole (RF-systole) as opposed to those frozen during end diastole (RF-diastole). Statistically, the SL of RF-systole (1.57 ± 0.12 µm, n = 5 hearts) was significantly shorter than that of RF-diastole (1.92 ± 0.14 µm, n = 5), as determined via one-way ANOVA followed by Tukey post-hoc test for multiple comparisons (P < 0.05). The SL of RF-diastole was comparable to that of the rapidly frozen hearts under pharmacological relaxation with 2,3-butanedione monoxime (RF-BDM-diastole: 1.97 ± 0.11 µm, n = 3) and hearts fixed by PFA-perfusion (1.82 ± 0.11 µm, n = 3). However, detailed examination of the localized SL distribution using heatmaps unveiled that the individual SL of RF-systole was nearly uniform and shorter, but showed some local longer regions (Figure 2, Scale bar: 50 µm). In contrast, the RF-diastole revealed the predominant SL elongation with patchy distributions of shorter regions. These local regions are highlighted with dotted-circles in both middle panels to ensure accessibility. Such SL spatial inhomogeneity was not seen in RF-BDM-diastole and PFA-fixed hearts. Additionally, we succeeded in obtaining snapshots of spatiotemporally chaotic SL dynamics in the heart during ventricular fibrillation via rapid-freezing, which was not possible with the conventional PFA fixation.
Conclusions
Phase-targeting rapid cryofixation of the beating heart enabled spatiotemporal and histological analysis of myocyte structures, which is difficult to achieve through conventional live imaging due to a trade-off between temporal resolution and the available signal. Our strategy will help investigate spatiotemporal changes of cardiac structures and associated physiological functions.