
By Tashi Raina and Alireza Mani from University College London (UCL), UK
The Historic Objects and Collections at UCL series explores historical physiological artefacts preserved in the Institute’s collection. This blog features two instruments, a blood flowmeter and a pressure manometer, which played important roles in cardiovascular physiology research conducted by Ernest Starling and his collaborators in the early twentieth century.
From anatomical observations to circulation
In 1628, William Harvey published a book that fundamentally altered the understanding of the human body. Exercitatio Anatomica de Motu Cordis et Sanguinis in Animalibus – shortened to De Motu Cordis – argued that blood was not continually produced by the liver to be consumed by the tissues, which had been the accepted theory. Instead, Harvey proposed that the heart pumped the blood around the body: from the heart through the arteries and back again through the veins [1].
At the University of Padua (Italy), Harvey studied under Hieronymus Fabricius and his work on the valves of the veins. Harvey recognised that these valves permitted the flow of blood towards the heart whilst obstructing flow in the opposite direction. Harvey also observed the heart in living animals to examine the sequence of contraction and relaxation [2]. One of his most challenging endeavours was rooted in a quantitative line of questioning, rather than observational. Harvey attempted to estimate how much blood the heart expelled during each contraction. He reasoned that if the heart expelled a set volume of blood with every beat, and beat dozens of times every minute, the amount of blood leaving the heart within a relatively short period would be enormous. This volume would be far greater than could plausibly be continually produced. Harvey therefore concluded that the same blood must somehow be returning to the heart and being pumped again [3].
His argument combined anatomical observation with experiment: the structure of the heart and vessels suggested directional movement, while the quantity of blood pumped by the heart made one-way consumption impossible. This marked an extraordinary milestone in the development of cardiovascular physiology, building upon earlier insights from Ibn al-Nafis (1213-1288), who had described pulmonary circulation based on anatomical observations [4]. However, they had answered only the first of many questions. Having established that blood circulated – subsequent generations of physiologists would investigate the velocity of the blood, the specific volumes that passed through vessels and how flow and pressure would change. To answer these questions observation would not nearly be enough – instruments and quantitative investigation would be required.
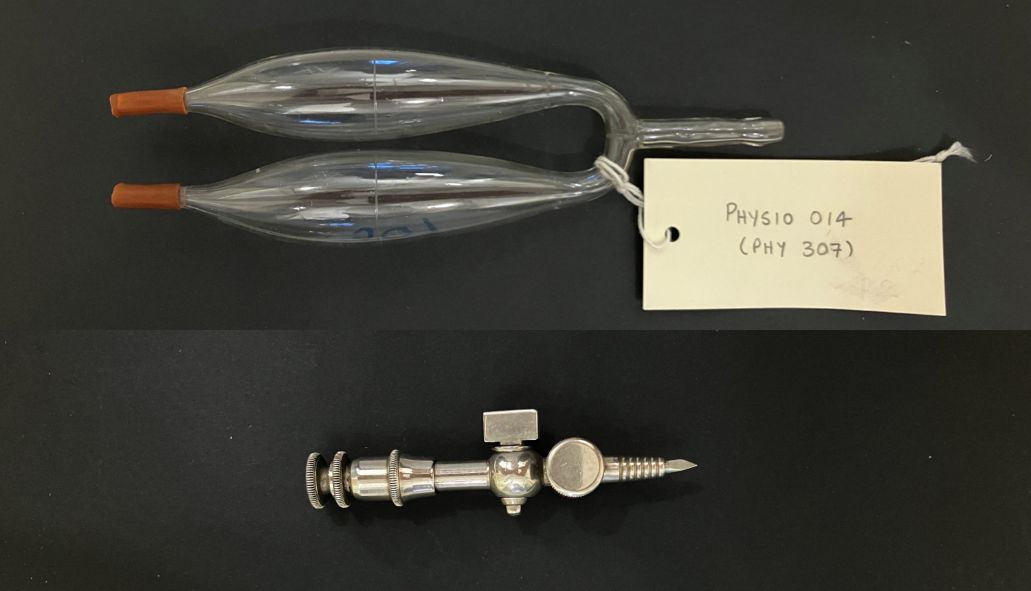
Figure 1. Ludwig’s stromuhr (upper panel) and Piper’s manometer (lower panel), preserved in the UCL Physiology Collection (Objects LDUSC-PHYSIO-14 and LDUSC-PHYSIO-13, respectively).
Measuring blood velocity
More than two centuries after Harvey’s De Motu Cordis, Alfred Wilhelm Volkmann (1801–1877) attempted to answer one of these new questions: how fast was blood actually moving through the vessels? Volkmann was a German physiologist, and published his extensive experimental work on haemodynamics in “Die Hämodynamik nach Versuchen” in 1850. To investigate the velocity of the blood, Volkmann developed the haemodrometer [5].
The haemodrometer was an invasive device, and consisted of a glass tube filled with water. This was inserted into a blood vessel, and the time taken for the blood to displace the water across a known distance was recorded. This allowed Volkmann to successfully calculate blood velocity. The haemodrometer represented a conceptual advance, now the movement of blood could be converted into a number [5]. However, a big question still persisted: how could blood flow be measured? Velocity and flow are different metrics; a narrow vessel and a wide vessel may contain blood travelling at similar velocities while carrying very different volumes. If physiologists wanted to understand how much blood was actually reaching a particular region of the body, measuring the velocity of the blood alone was not enough. A new method would be required – and this was to be developed by the famed physiologist Carl Ludwig (1816-1895).
Measuring blood flow
By the middle of the nineteenth century, Carl Ludwig had become one of the most important figures in experimental physiology. He was a pioneer of a new approach to the subject and maintained rigorous scientific standards within his famed Leipzig Physiological Institute [6]. Physiological questions increasingly became questions that could be investigated through controlled experiments, attracting researchers from across Europe and beyond. The development of the stromuhr emerged from this environment.
Johann Dogiel worked in Ludwig’s laboratory at Leipzig, and published “Die Ausmessung der strömenden Blutvolumina” – “The Measurement of Flowing Blood Volumes” in 1867 [7]. The apparatus became known as Ludwig’s stromuhr, and Ludwig is generally credited with its design. However, Dogiel published the first detailed account of the apparatus and its use. The original publication appeared in the Arbeiten aus der Physiologischen Anstalt zu Leipzig, making the stromuhr a product of Ludwig’s experimental school [8].
Ludwig’s Stromuhr
The German word Stromuhr translates to “flow clock.” Its purpose was fundamentally different from Volkmann’s haemodrometer. The haemodrometer measured how quickly blood travelled while the stromuhr measured how much blood travelled.
The original stromuhr consists of two identical glass bulbs of known volume connected together (Figure 1, upper panel). At the beginning of the experiment, one bulb contains defibrinated blood removed from the testing organism, while the other contains a suitable immiscible fluid, commonly oil. This prevents the oil and blood from mixing in the thin connecting tube between each bulb, forming a clear barrier. The apparatus is placed directly into the path of the blood of an exposed vessel; the oil bulb nearer to the heart (source of flow) and then the blood bulb. The flowing blood from the organism enters the apparatus, displaces the oil from the first bulb into the second, which pushes the defibrinated blood back into the organism’s system. Physiologists measure the time taken for the entire volume of oil in the first bulb to be displaced to the second bulb. Flow is derived from Volume divided by Time, and scientists were able to accurately measure flow using this method [9].
Now the second bulb contains the oil, and the first contains newly arrived blood from the system. However, the system cannot continue in this way. The newly incoming blood into the first bulb will force the oil into the circulation, disrupting and damaging the organism. The system needs to be reset. Therefore, after each point where the first bulb fills with new blood, the physiologist rotates the apparatus 180 degrees, making the second bulb – which is filled with oil – nearest the heart. The oil filled bulb is now in the first position, and ready to be displaced again by incoming blood, timed and measured [9].
Further refinement of Stromuhr
Different physiologists adapted the instrument to suit specific experiment requirements, different vessels and different forms of recording. The instrument was modified within Ludwig’s own laboratory and later by other researchers. By the early twentieth century, the stromuhr was no longer a single object, but an established family of instruments based on the principle of measuring flow. Two famed physiologists who modified the stromuhr were Ernest Starling and Hidetsurumaru Ishikawa and their work revolved around improving its simplicity.
In the early twentieth century, Japanese physiologist Ishikawa collaborated with Starling at the Institute of Physiology at UCL. In 1912, Ishikawa and Starling published On a Simple Form of Stromuhr in The Journal of Physiology [10]. Their contribution was explicitly a “simple form” of an established device. The Ludwig stromuhr employed a very elaborate double-chamber arrangement. Blood displaced a fluid through a known volume of a bulb, after which the apparatus had to be reset by rotating the system for another measurement. Ishikawa and Starling retained the fundamental concept of the stromuhr but proposed a simpler apparatus intended for ease of practical use.
Instead of using two bulbs containing oil and blood that relied on rotation, Ishikawa and Starling devised a self-acting system based on siphonage (Figure 2). Blood from an artery entered the upper vessel (A) and as the blood entered A it compressed the air that was trapped within the apparatus. The resulting pressure pushed the blood initially contained in the lower vessel (B), into the peripheral circulation. This allowed blood to leave B while A was filling. Once the blood in A reached the top of the siphon tube, it would trigger and the contents of A would rapidly siphon into B. This would leave A empty and ready to be filled again without the need to manually rotate the apparatus (Figure 2). Each cycle consisted of a known volume of blood, therefore the frequency of these siphoning events provided a measure of blood flow [10].
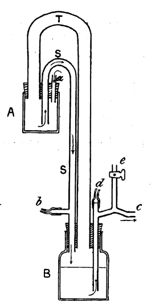
Figure 2. Schematic of Ishikawa and Starling’s version of the Stromuhr. The figure is reproduced from Ishikawa and Starling’s paper published in the Journal of Physiology in 1912 [10].
Measurement of pressure within the heart chambers
The improved stromuhr replaced the manual rotation of the classical instrument with a self-resetting mechanism and transformed the measurement of flow into a continuous process. Even with these modifications, there were many questions of cardiac physiology that remained unanswered. Measuring blood flow provided only part of the picture of circulation. To understand what drives blood flow and why it changes, physiologists needed to investigate the underlying mechanical forces. This brought a new challenge to the forefront: measuring pressure within the heart chambers. Once again, the physiological problem demanded a new kind of instrument – one that could accommodate a very sensitive scale for pressure.
One of the earliest forms of the manometer – the U-tube – is credited to Christiaan Huygens in 1661. His invention is an adaptation of the earlier mercury barometer created by Evangelista Torricelli (1608 – 1647), which demonstrated how pressure could be represented by the height of liquid in a column [11]. Huygens built upon this concept to develop the U-tube manometer for measurement of pressure [12].
The U-tube manometer had a simple mechanism. It consisted of a glass tube bent into a U shape, with a set volume of mercury at the bottom. Pressure is applied to one side of the U shape, which pushes the mercury further up the other side. The difference in height between the two sides indicates the difference in pressure. Huygens’s instrument demonstrated the visible movement of liquid as a result of invisible pressure. Water manometers were used for relatively lower venous pressures and mercury manometers for the higher arterial pressures. The U-tube manometer was ideal for measuring pressures that remained relatively stable, and were incredibly useful for measuring pressure in blood vessels. By the early 20th century, mercurial manometers were included in standard physiological practice.
However, when the question arose of the beating heart, the mercurial manometer was not well suited for its rapid pressure changes. Mercury is very dense and would not be able to accelerate fast enough to reproduce every pressure change accurately. This causes lag, damping and distortion of the actual pressure quantity. Major changes to the manometer were required. Otto Frank (1865-1944) had already pioneered the use of optical methods for recording rapid pressures directly in the chambers of the heart [13]. Hans Piper (1877-1915) then further developed this concept into his own manometer (Figure 1, lower panel).
Piper’s pressure manometer
This instrument had three major components (Figure 3): (a) a trocar was a sharp instrument used to penetrate the wall of the heart, (b) a tiny pressure chamber called a tambour and (c) a rubber membrane with a small mirror attached [14]. The instrument was inserted directly into the ventricle; when the ventricular pressure rose, the pressure pushed against the rubber membrane which caused it to bulge slightly outward. The bulge is a very tiny movement, far too small to record directly. The solution was a tiny mirror attached to the membrane. When the membrane moved the mirror would move. A light source would be trained onto the mirror for the duration of the experiment, when the membrane bulged, it moved the mirror minutely which reflected the light onto the recording paper of a kymograph. Because the mirror and membrane were so small and light, they could respond instantly to any pressure changes. The kymograph would translate these delicate pressure changes into readable waveforms [14].
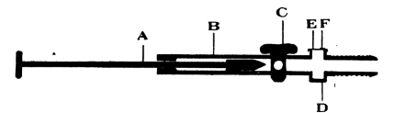
Figure 3. Schematic of Piper’s trocar manometer. The figure is reproduced from Patterson, Piper and Starling’s paper published in the Journal of Physiology in 1914 [14].
Piper combined ideas to develop this high frequency, optical membrane manometer; referred to as Piper’s trocar manometer. It was designed to be inserted directly into a heart chamber and would allow for the most miniscule of physiological events to be recorded. that Piper’s manometer was utilised within Starling’s and Patterson’s precision heart-lung preparation which successfully recorded rapid ventricular end-diastolic pressure changes. This breakthrough formed a critical part of the landmark 1914 publication: The Regulation of the Heartbeat in the Journal of Physiology by Patterson, Piper and Starling [14].
The development of these instruments reflects a wider transformation in the study of cardiovascular physiology. Harvey had demonstrated that blood circulated, largely through anatomical observation, experiment and quantitative reasoning; subsequent generations of physiologists increasingly sought to make that circulation measurable. Volkmann converted the movement of blood into a velocity, while Ludwig and Dogiel provided a means of measuring the volume passing through a vessel. Ishikawa and Starling subsequently made this measurement more automatic and continuous, replacing manual manipulation with a self-resetting siphon mechanism. Yet measuring the movement of blood was only part of the physiological problem.
To understand how that movement was produced, researchers also had to measure the rapidly changing pressures generated by the heart itself. The evolution from the liquid-column manometer to Frank’s optical methods and Piper’s highly sensitive trocar manometer made these previously fleeting mechanical events visible and recordable. Taken together, these instruments reveal how cardiovascular physiology progressed not simply through new ideas, but through the development of increasingly precise ways of making the invisible processes of the living body measurable.
Each major discovery gave rise to new questions, gradually bringing together the pieces of a larger picture of the cardiovascular system. This history illustrates how scientific progress depends on collaboration, curiosity and the continuous refinement of experimental techniques. Each generation of physiologists built upon the work of those before them, not only finding answers but also ensuring that the future is filled with great questions.
Acknowledgment: The authors are grateful to Alanna Orpen (The Physiological Society) for her collaboration and expert advice.
Discover more about the history of physiology. If you’ve missed the previous blogs by the UCL Historic Objects and Collections team, read the series to find out more about the inventors and their physiological instruments. Enjoy Bárány’s mechanical soundbox, the smoked-paper etchings of the Kymograph, measuring muscle heat with the Thermophile, uncovering the nature of nerve signals, nerve stimulation with the inductorium, the sensitivity of the Hartridge Reversion Spectroscope to quantify carbon monoxide levels in the blood and the lives saved by the Haldane apparatus. Find out more about the lives and work of Lucy Wills and Winifred Cullis, and the significance of the clamp that was passed on from mentor Ernest Starling to his pupil Ernest Verney.
References
- Harvey, W. (1628). Exercitatio Anatomica De Motv Cordis Et Sangvinis in Animalibvs. doi:10.5479/sil.126677.39088002685501.
- Pasipoularides, A. (2013). Historical perspective: Harvey’s epoch-making discovery of the circulation, its historical antecedents, and some initial consequences on medical practice. Journal of Applied Physiology, 114(11), pp.1493–1503. doi:10.1152/japplphysiol.00216.2013.
- Neuss, M.J. (2018). Blood money: Harvey’sDe motu cordis(1628) as an exercise in accounting. The British Journal for the History of Science, [online] 51(2), pp.181–203. doi:10.1017/s0007087418000250.
- West JB (2008). Ibn al-Nafis, the pulmonary circulation, and the Islamic Golden Age. Journal of Applied Physiology, 105(6), 1877–1880. DOI: 10.1152/japplphysiol.91171.2008
- Volkmann, A. W. (1850). Die Hämodynamik nach Versuchen. Leipzig: Breitkopf und Härtel. 483 pp.
- Fye, W.B. (1986). Carl Ludwig and the Leipzig physiological Institute: ‘A factory of new knowledge’. Circulation, 74(5), pp.920–928. doi:10.1161/01.cir.74.5.920.
- Dogiel, J. (1879). Zur Kenntniss Der Eiweissreactionen und von dem verhalten des albumins der Lichtbrechenden Medien des auges. Pflüger, Archiv für die Gesammte Physiologie des Menschen und der Thiere, 19(1), pp.335–342. doi:10.1007/bf01639854.
- Fye, W.B. (1986). Carl Ludwig and the Leipzig physiological Institute: ‘A factory of new knowledge’. Circulation, 74(5), pp.920–928. doi:10.1161/01.cir.74.5.920.
- Encyclopædia Britannica (Vascular System, 1911, volume 27) (https://en.wikisource.org/wiki/1911_Encyclop%C3%A6dia_Britannica/Vascular_System [Accessed 13 Sept. 2026])
- Ishikawa, H. and Starling, E.H. (1912). On a simple form of stromuhr. The Journal of Physiology, 45(3), pp.164–169. doi:10.1113/jphysiol.1912.sp001543.
- West, J.B. (2013). Torricelli and the ocean of air: The first measurement of barometric pressure. Physiology, 28(2), pp.66–73. doi:10.1152/physiol.00053.2012.
- Daood, S., Ijaz, A. and Butt, M. (2007). Study on a concentric tube bulb manometer and its performance compared to u-shaped manometer. Sensors, 7(11), pp.2835–2845. doi:10.3390/s7112835.
- Sagawa, K. (1990). Translation of Otto Frank’s paper “die grundform des arteriellen pulses” zeitschrift für biologie 37: 483–526 (1899). Journal of Molecular and Cellular Cardiology, 22(3), pp.253–254. doi:10.1016/0022-2828(90)91459-k.
- Patterson, S.W., Piper, H. and Starling, E.H. (1914). The regulation of the heart beat. The Journal of Physiology, 48(6), pp.465–513. doi:10.1113/jphysiol.1914.sp001676.